DIRAC ++
1.
Pion-kaon atom
2.
Why
SPS?
3.
Setup
4.
Detectors
5.
Plans
Back to DIRAC Main page
Pion-kaon atom
πK-atom (AπK) is a hydrogen-like
atom consisting of K+ (K−) and π−
(π+) mesons. The πK-atom lifetime
(ground state 1S),  is
dominated by the annihilation process into π0K0.
There is a relation between the width of AπK decay and
S-wave πK scattering lengths for isospin 1/2 and 3/2 [1]:
is
dominated by the annihilation process into π0K0.
There is a relation between the width of AπK decay and
S-wave πK scattering lengths for isospin 1/2 and 3/2 [1]:
 (1)
(1)
Here α
is the fine structure constant, µ is the reduced mass of the π±K∓ system, p∗ is the
outgoing π0 momentum in the πK atom system,
and δK accounts for corrections, due to isospin
breaking, at order α and quark mass difference (mu −
md).
Prediction of scattering length
difference [2] provides an estimation of lifetime of AπK in
ground state to be: τ = (3.5 ± 0.4) × 10−15.
A method of
investigation for π+π−, πK
and other atoms, consisted of two oppositely charged mesons, has been
proposed in [3]. Pairs of K+ (K−) and
π− (π+) mesons are
producing in proton-target interactions. Pairs, which are generated from
fragmentation and strong decays (“short-lived” sources), are affected by
Coulomb interaction in the final state. Some of them form Coulomb bound states
— atoms, other are generated as free pairs (“Coulomb pairs”). Number of
produced atoms (NA) is proportional to a number of “Coulomb
pairs” (NC) with low relative momentum Q in a pair
C.M. system: NA = K · NC. The
coefficient K is calculated with an accuracy better than 1% [4].
If at least one
meson is generated from long-lived sources (electromagnetically or weakly
decaying mesons or baryons: η, η0, Ks0, ...), then such pairs (“non-Coulomb pairs”) are not
affected by interaction in the final states.
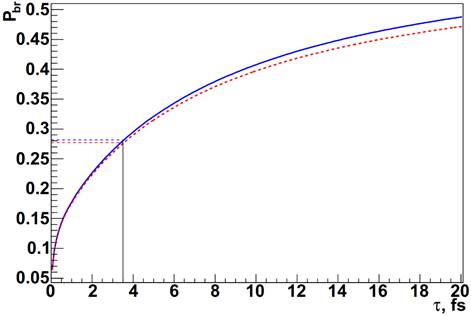
After production, AπK
travel through the target and could to annihilate into π0K0,
or to be ionised due to interaction with the target matter, producing specific
“atomic pairs”. These pairs have small relative momentum (Q < 3 MeV/c)
and a number of such pairs nA could be measured
experimentally. Ratio of “atomic pair” number to a number of atom produced is a
breakup probability: Pbr(τ) = nA/NA
= nA/(K·NC) [5, 6]. In Fig
dependence of AπK breakup probability is shown for two
nickel target are used in experiment DIRAC for pair laboratory momentum range 5.1÷8.5
GeV/c. Value is averaged, using experimentally measured spectrum of
atoms.
References
[1] J. Schweizer, Phys. Lett. B 587, 33 (2004)
[2] J. Bijnens et al., JHEP 0405, 036 (2004)
[3] L. Nemenov, Sov. J. Nucl. Phys. 41, 629 (1985)
[4] L. Afanasyev and O. Voskresenskaya, Phys. Lett. B 453,
302 (1999)
[5] L. Afanasyev and A. Tarasov, Phys. At. Nucl. 59,
2130 (1996) [6] M. Zhabitsky, Phys. At. Nucl. 71, 1040 (2008)
Why SPS?
Experimental data on the πK low-energy
phases are absent. The only experimental pion-kaon scattering length
measurements have been done with estimation of πK atom lifetime
[12]:
 , (8)
, (8)
and [13]:
 . (9)
. (9)
Table 1: Yields of atoms (WA)
and charged particles (Wch) per one proton nuclear
interaction. Values normalized by experimental condition of experiment DIRAC
are presented as  and
and  , correspondingly. Ratio (WA/Wch)N
presents gain in statistic of atoms for the same background
conditions.
, correspondingly. Ratio (WA/Wch)N
presents gain in statistic of atoms for the same background
conditions.
|
θlab
|
5.7°
|
4°
|
2°
|
0°
|
|
Ep
|
24 GeV
|
450 GeV
|
450 GeV
|
450 GeV
|
|
Yield
charged particles
|
|
Wch
|
0.022
|
0.14
|
0.50
|
2.9
|
|
|
1
|
6.4
|
22.7
|
132
|
|
Yield of
π+π− atoms
|
|
WA × 109
|
1.94
|
34.
|
69.
|
89.
|
|
|
1.
|
17.3
|
35.4
|
45.9
|
|
(WA/Wch)N
|
1.
|
2.4
|
1.2
|
0.27
|
|
Yield of
π+K− atoms
|
|
WA × 109
|
0.217
|
8.1
|
16.3
|
23
|
|
|
1.
|
37.5
|
75.
|
106.
|
|
(WA/Wch)N
|
1.
|
10.6
|
5.8
|
1.2
|
|
Yield of
K+π− atoms
|
|
WA × 109
|
0.52
|
8.5
|
19.
|
30.
|
|
|
1.
|
16.4
|
37.6
|
57.4
|
|
(WA/Wch)N
|
1.
|
4.9
|
3.0
|
0.66
|
Present experimental accuracy is not sufficient for
test of Low Energy QCD prediction. As shown in [14], the number of πK atoms
detected per time unit would be increased by a factor of 30 to 40, if the DIRAC
experiment could exploit the CERN SPS 450 GeV/c proton beam. Table 1
shows yield of atoms (WA) and charged particles (Wch)
per one proton-nuclear interaction at different momenta of proton beam (Ep)
and angles between proton beam and secondary beam channel (Θlab).
Values WAN and WchN shows
change relative to experimental conditions of experiment DIRAC. Statistic,
taken in certain time, also depends on beam intensity, which is limited by a
flux of charged particles through detectors of the setup. Ratio WA/Wch)N
provides gain from new beam energy and the setup angle for the same
beam time.
On the base of experimental data, estimation [15] of a time needed for
measurement  with
statistical accuracy
with
statistical accuracy  for
existed DIRAC setup and beam condition (Nickel target only) has been done and
results are presented in Table 2: here Mod1 is for DIRAC setup at Ep =
450 GeV beam (small modification due to another geometry of secondary particle
beam); Mod2 is for essentially modified DIRAC setup at 450 GeV beam with higher
intensity (IB). It is assumed that at 450 GeV beam setup
would obtain 3000 spills (4.5s) per day.
for
existed DIRAC setup and beam condition (Nickel target only) has been done and
results are presented in Table 2: here Mod1 is for DIRAC setup at Ep =
450 GeV beam (small modification due to another geometry of secondary particle
beam); Mod2 is for essentially modified DIRAC setup at 450 GeV beam with higher
intensity (IB). It is assumed that at 450 GeV beam setup
would obtain 3000 spills (4.5s) per day.
•
Expected statistic of πK atomic
pairs: nA ≈ 13000.
•
Statistical accuracy of πK
scattering length difference: ∼
5%.
•
Expected systematic error: ∼ 2%.
•
Expected statistic of π+π−
atomic pairs: nA ≈ 400000.
•
Statistical accuracy of π+π−
scattering length difference: ∼
0.7%.
•
Expected systematic error: ∼ 2%.
Table 2: Estimation of time needed for
measurement with statistical accuracy for present DIRAC setup and beam
condition, and for versions Mod1 and Mod2, modified for proton beam energy Ep =
450 GeV and intensity IB (proton per second). Angle between primary and
secondary beams θlab and solid angle of secondary beam aperture are presented.
It is assumed, that at 450 GeV beam the setup would obtain 3000 spills (4.5s)
per day.
|
Setup
|
Ep
|
Ib
|
θlab
|
Solid
angle
|
Beam
time
|
Run time
|
|
|
|
GeV
|
p/s
|
|
sr
|
s
|
months
|
%
|
|
Existed
|
24
|
2.7
· 1011
|
5.7
|
1.2
· 10−3
|
1.2
· 106
|
14.5
|
43.
|
|
Mod1
|
450
|
1.0
· 1011
|
4.0
|
0.6
· 10−3
|
5.5
· 106
|
13.6
|
5.
|
|
Mod2
|
450
|
1.0
· 1012
|
4.0
|
0.6
· 10−3
|
6.5
· 105
|
1.6
|
5.
|
References
[1]
V. Bernard et al., Phys.
Rev. D 43, (1991) 2757.
[2]
A. Roessl, Nucl. Phys. B 555,
(1999) 507.
[3]
J. Bijnens et al., JHEP
0405, (2004) 036.
[4]
P. Buttiker et al., Eur.
Phys. J. C 33, (2004) 409.
[5]
S.R. Beane et al., Phys.
Rev. D 77, (2008) 094507.
[6]
C.B. Lang et al., Phys.
Rev. D 86, (2012) 054508.
[7]
K. Sasaki et al., Phys.
Rev. D 89, (2014) 054502.
[8]
T. Janowski et al., PoS
LATTICE2014 (2015) 080.
[9]
S.R. Beane et al., Phys. Rev. D 74
(2006) 114503.
[10] Z. Fu, Phys. Rev. D 85 (2012) 074501.
[11] K. Sasaki et al., Phys. Rev. D 89 (2014) 054502.
[12] B. Adeva et al., Phys. Lett. B 735, (2014) 288.
[13] B. Adeva et al., arXiv:1707.02184 [hep-ex].
[14] O. Gorchakov and L. Nemenov, J. Phys. G: Nucl. Part.
Phys. 43 (2016) 095004.
[15] V. Yazkov, DN-2016-05 (DN = DIRAC Note), http://cds.cern.ch/record/2207227
TOP TOP
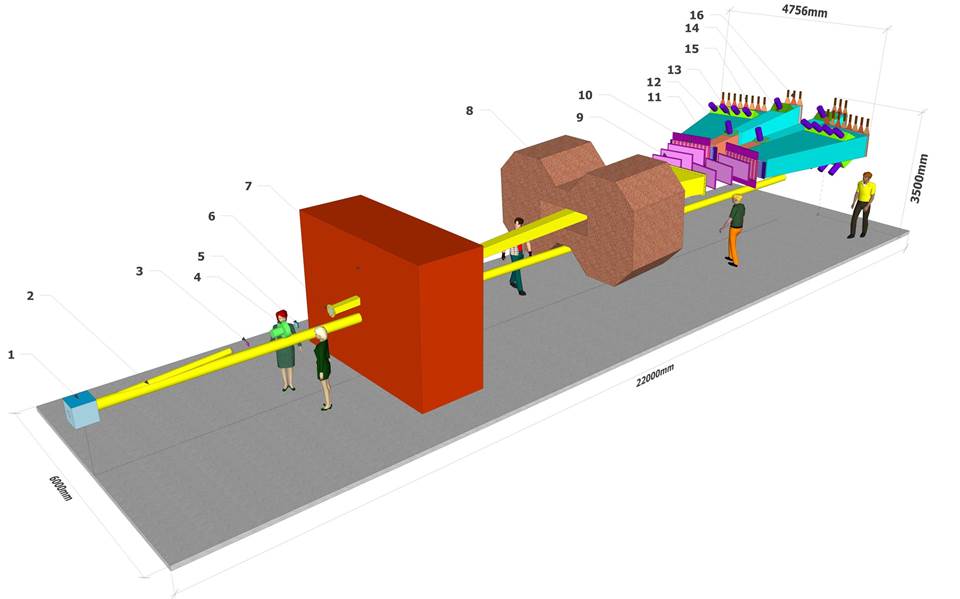
Setup
TOP TOP
Detectors
|
Setup element (number
planes)
|
Aperture
|
Occupancy
|
X0
|
Resolution
|
|
Coordinate
|
Time
|
|
cm
|
s−1 · cm−2
|
%
|
µm
|
ns
|
|
1.
Target Station
2.
Vacuum system
3.
Vertex detector (2
÷
4)
|
7.6 × 7.6
|
(5 ÷ 20) · 105
|
0.7 ÷ 1.5
|
50 ÷ 100
|
0.2 ÷ 0.4
|
|
4.
RICH?
|
9.0 × 9.0
|
(4 ÷ 16) · 105
|
< 5
|
|
< 1
|
|
5.
SFD (3)
|
10. × 10.
|
(3 ÷ 12) · 105
|
2.7
|
60 ÷ 130
|
0.4
|
|
6.
Vacuum system
7.
Iron shielding
wall
8.
Spectrometer
magnet
|
155 × 50
|
|
|
|
|
|
9.
Downstream Tracker
(2 × 8)
|
75 ÷ 110×44
|
(1 ÷ 10) · 104
|
4 ÷ 8
|
< 80
|
|
|
10.Vertical Hodoscope (2 × 1 ÷ 2)
|
112 × 44
|
(1 ÷ 8) · 104
|
|
|
< 0.7
|
|
11. Horizontal Hodoscope (2)
|
115 × 44
|
(1 ÷ 8) · 104
|
|
|
< 0.5
|
|
12.Heavy Gas Cherenkov detector (2)
|
30 × 49
|
(1 ÷ 8) · 104
|
|
|
< 1.0
|
|
13.Nitrogen Cherenkov detector (2)
|
90 × 50
|
(1 ÷ 10) · 103
|
|
|
< 1.0
|
|
14.Nitrogen Cherenkov detector (2)
|
37 × 53
|
(1 ÷ 8) · 104
|
|
|
< 1.0
|
|
15.PreShower detector (2)
|
148 × 60
|
(1 ÷ 8) · 103
|
|
|
< 1.0
|
|
16.PreShower detector (2)
|
56 × 60
|
(5 ÷ 40) · 103
|
|
|
< 1.0
|
TOP TOP
Plans
These results have been presented on Physics Beyond Colliders
Workshop and are under consideration of PBC Committee as DIRAC++. Work under
LOI for experiment at 450 Gev proton beam is started.
TOP TOP