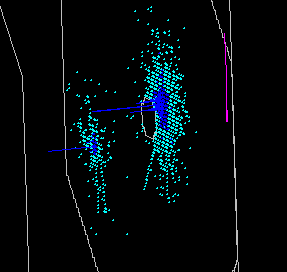
A decay of a neutral kaon in two charged pions

This is a Monte-Carlo simulated event shown using the NA48 Event Display
Top Left
the energy released in the two calorimeters seen from the incoming beam direction. The e.m. calorimeter is readout 2-dimensionally The energy released in each of the 13000 2x2 cm cells is color-coded in light and dark blue (lower and higher energy released). One sees two separates clusters produced by the two pions. Notice how part of the energy of the rightmost pion is lost into the central hole of the calorimeter, that houses the beam-pipe. The cell in yellow is the one for which the pulse-shape is shown in the Bottom-Right plot.

One also sees, in purple on the sides, the histograms of the energies released in the x and y view of the hadron calorimeter

Top Right
In red, the hits produced by the two pion tracks on the 32 wire-chambers planes, again seen from the incoming beam direction.
Bottom Left
In blue, the 4 Hodoscope counters (2 horizontal and 2 vertical) hit by the two incoming pions
Bottom Right
An histogram showing the pulse-shape of a given cell (in yellow in Top-Right) measured by its 40 MHz Flash-ADC. In abscissa the FADC samples (each bin 25ns), in y the measured cell current (in some units), proportional to cell-released energy

3-d representation of the e.m. calorimeter measured energy. The two peaks correspond to pion impact points. The color codes are the same as above.