AFFAIR manual for DATE users1 IntroductionThe AFFAIR[1] package monitors the DATE software as well as the system behavior of the computer cluster where DATE is running. It is installed separately from DATE and can be downloaded from the AFFAIR Web site http://www.cern.ch/affair, with the full code and detailed installation instructions. Figure 1 gives an overview of the AFFAIR system. It extracts performance data from the monitored nodes and forwards it in fixed time intervals to the monitoring station, where the data is stored and analysed. Summary plots accesible via a Web server or the Affair Control are also created on the monitoring station. All communications and data transfer use the DIM/SMI client/server software of DATE. The main AFFAIR processes, running on the monitored nodes are:
The main AFFAIR processes, running on the monitoring station are:
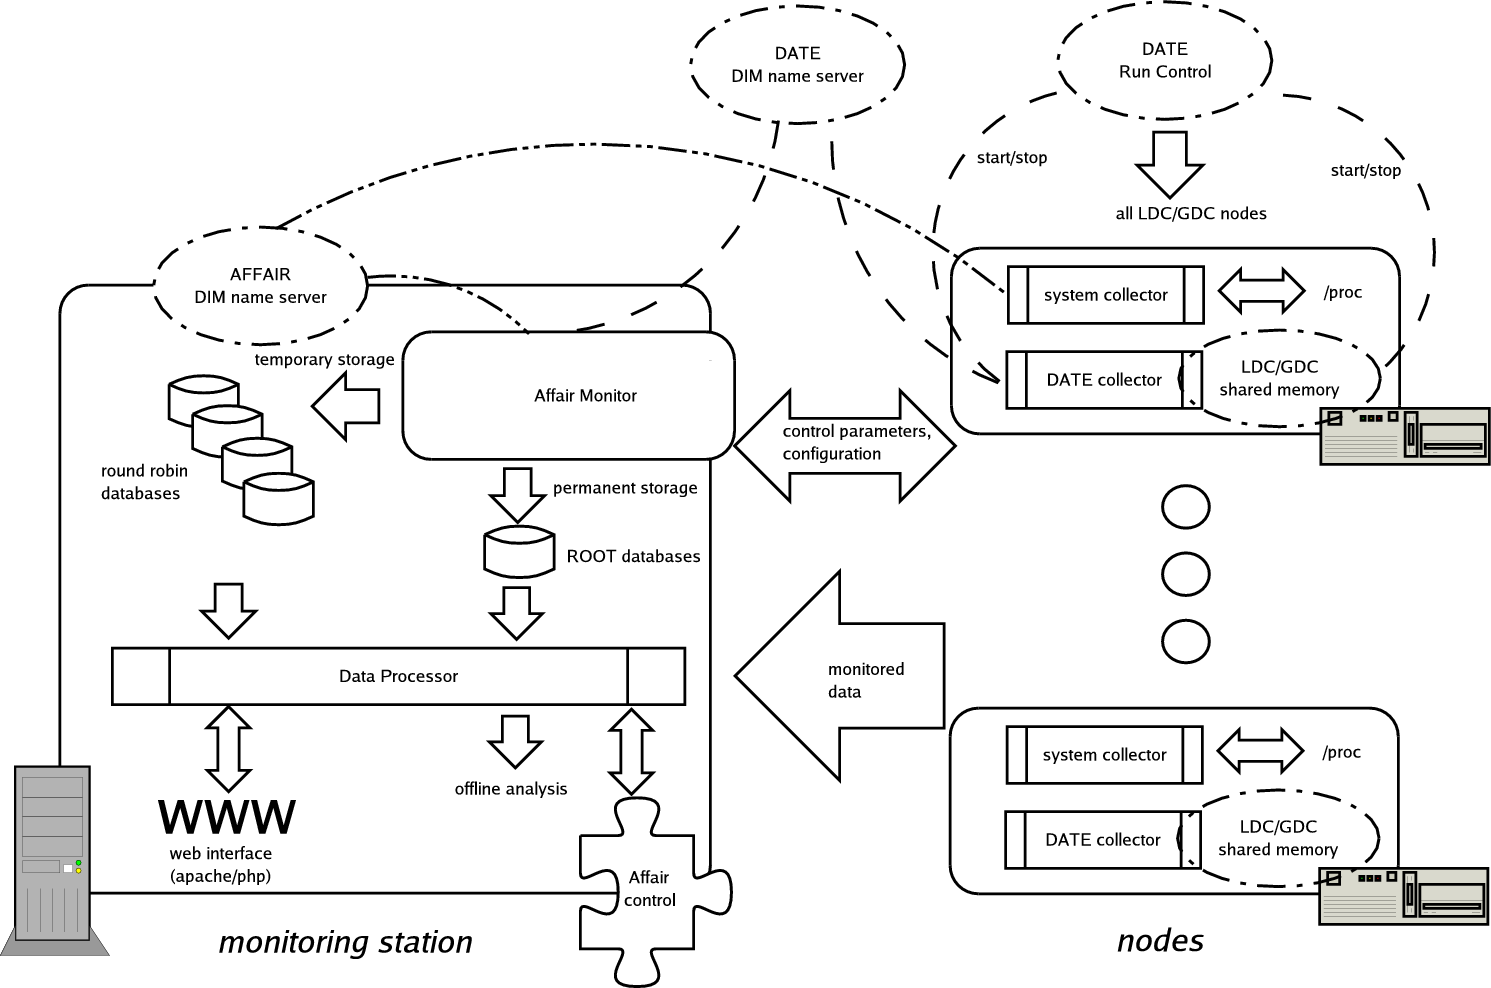
Figure 1:Overview of the Affair structure2 Installation of the monitoring stationThe monitoring station is the host where data collection, storage and analysis of performance data takes place and where the Web interface is located. The following packages must be installed on the monitoring station: The steps involved in the installation are the following:
The AFFAIR user should also start the DIM name server on both the DIM_DNS_NODE computer (the standard DATE DIM name server) and the AFFAIR_DNS_NODE computer (the AFFAIR specific DIM name server). Note that for the simplicity these two name servers can be the same.
1 Apache Web server with PHP support installationThe system configuration on the monitoring station may already have a combination of apache/PHP running. To enable AFFAIR installation without interferring with existing web server setups, several web server installation scenarios are considered:
In all cases the path/name of the PHP configuration file has to be declared via the environment variable PHPCONFIG, which is required by the AFFAIR Web interface. In systems where PHP code comes with a preinstalled Apache Web server, this file is usually /usr/local/bin/php-config. Consider these cases in more detail:
1 No apache web serverif the monitoring station has no Web server, the simplest procedure is to download the Apache and PHP code from the AFFAIR site, and then run as root the Web installation script in $AFFAIR_MONITOR. For example,
installs the Web server with PHP support in the /usr/local/apache directory (the default Apache directory) and configures the Apache configuration file httpd.conf to be able to run PHP scripts. It also adds some internet security features to httpd.conf. The default path of the php-config is /usr/local/bin/php-config.
2 Apache with PHP, but no PHP source codeOften the PHP source code is not included in a distribution with a functioning web server with PHP support. The AFFAIR site has the relevant code which can be downloaded into any directory ( e.g. /local/phptmp), and installed (e.g. in /local/php) by:
The PHPCONFIG environment variable for this example is /local/php/bin/php-config.
3 Apache with PHP, and PHP source codeNothing needs to be done.
4 starting apacheThe apache daemon is started by:
It is recommended to start apache at boot time, by adding the following line to the file /etc/rc.d/rc.local:
2 environment configurationThe directory where the AFFAIR code on the monitoring station will be downloaded and installed needs to be declared as AFFAIR_MONITOR. In addition, all the relevant paths and environment variables for DIM and SMI (both the standard DATE and AFFAIR specific name server), ROOT, and PHP need to be declared. The best method is to add them to the /.bashrc file. A typical example is:
As ROOT has to be accesible also from the Apache Web server its environment variables have to be in a common location such as /etc/profile, and not in a user specific one. Thus /etc/profile should contain:
3 AFFAIR instalationThe affairMonitorVERSION.tar.gz file (e.g. affairMonitor2.6.tar.gz ) needs to be downloaded to the $AFFAIR_MONITOR directory from the AFFAIR site http://www.cern.ch/affair. At this point AFFAIR can be installed as follows:
This compiles the full AFFAIR code for the monitoring station. At this stage the Web interface can be enabled. The Web server should be linked (needed to be root) to the appropritate AFFAIR code:
The AFFAIR Web is accessed with:
3 Installation of the nodesThe affairDateVERSION.tar.gz file available on the AFFAIR Web page needs to be downloaded on every node where DATE is running, and placed in the $AFFAIR directory (a usual DATE setup already defines AFFAIR as /date/affairRC). If the $AFFAIR directory is on a shared file system, this needs to be done only once. The AFFAIR_DNS_NODE environment variable has to be declared in addition to the standard DATE environment variables. The file $DATE_SITE_CONFIG/AFFAIR.config should be changed or created to have the content shown in table I, adjusted to the actual setup:
Table I:The file $DATE_SITE_CONFIG/AFFAIR.configAfter this, the code can be compiled:
The AFFAIR Collectors running on the LDCs and GDCs are started by the run control via the script /date/runControl/AFDC.sh By default, this script starts only a dummy process, so it must be changed to actually start the AFFAIR Collectors. The script shown below is suggested, but it is up to the user to write his/her own.
4 Configuration and operationAFFAIR processes need to be started on all the monitored nodes as well as the monitoring station. The monitored nodes are enabled by the DATE runControl, where the setting of the checkbutton marked AFFAIR starts the monitoring on all the LDC and GDC nodes. The easiest way to configure and operate AFFAIR is to use on the monitoring station the affairControl script:
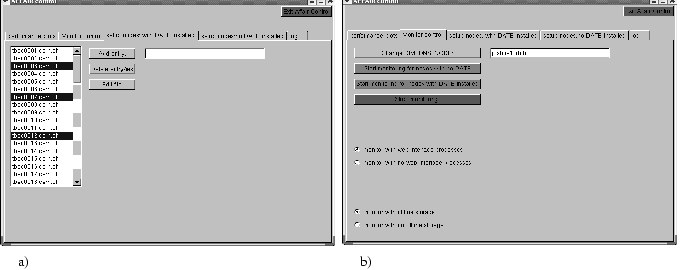
This script starts a GUI which allows easy setup and configuration of the monitored nodes, as well as viewing of all performance plots accesible via the Web interface. Figure 2a shows the tab in in the AFFAIR Control used to modify the list of monitored nodes. The full hostname must be specified (for example, it should be pcdaq01.cern.ch and not pcdaq01). Pressing the ``Start monitoring for nodes with DATE installed'' button in the Monitor control (figure 2b) tab starts performance data collection and storing. Afterwards the ``performance plots'' tab will provide access to graphs of the analysed data (see figure 3). The default behavior of the AFFAIR Monitor is to write to both temporary online databases and permanent ROOT offline storage, as well as to create performance plots accessed via the Web interface. The offline storage can be turned off by clicking on the appropriate radio button in this tab. It is also possible to disable the plot creation. This can be useful if only AFFAIR Control is used to inspect the performance. Figure 2:Affair Control: a) Tab for setting up DATE parameters and b) Tab for starting and controling AFFAIR monitoring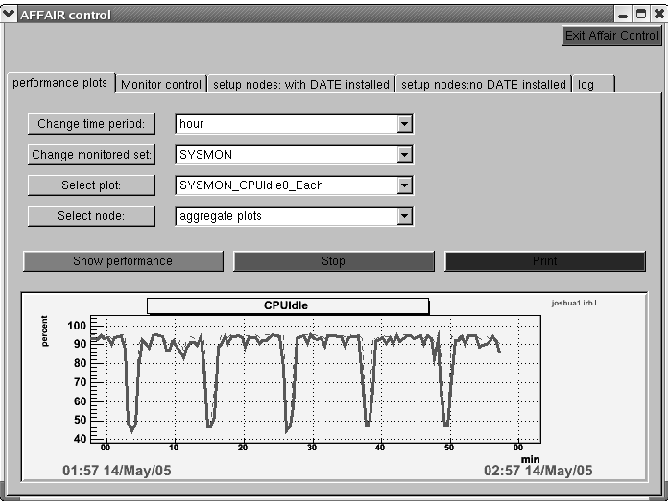
Figure 3:Affair Control tab giving access to all the performance plots1 Automating the monitoring stationCron jobs are a good way to ensure that the monitoring station processes start at boot time and that they smoothly recover from possible crashes. For example, if /local/affair is the AFFAIR_MONITOR directory, then the following cron job starts monitoring the nodes with offline storage (entered using the crontab -e shell command):
To disable offline storage, the monitor_nopermstore parameter is used instead of monitor. The startProcess.sh script starts the AFFAIR Monitor and several instances of the Data Processor (see section V.F) with the appropriate flags.
5 Detailed descriptionIn this section a more detailed description of AFFAIR components is presented.
1 Monitored valuesThe performance data is grouped into three types, named monitoring sets, depending on which Collector is used:
The performance data is separately analysed and plotted for each monitoring set. Tables II and III show the monitored values for the different monitoring sets. The definition of the partitions 1 to 3, of the disks 1 and 2, and of the network card is done via configuration file (see section VI.C).
Table II: LDC and GDC monitored values
Table III:System monitoring
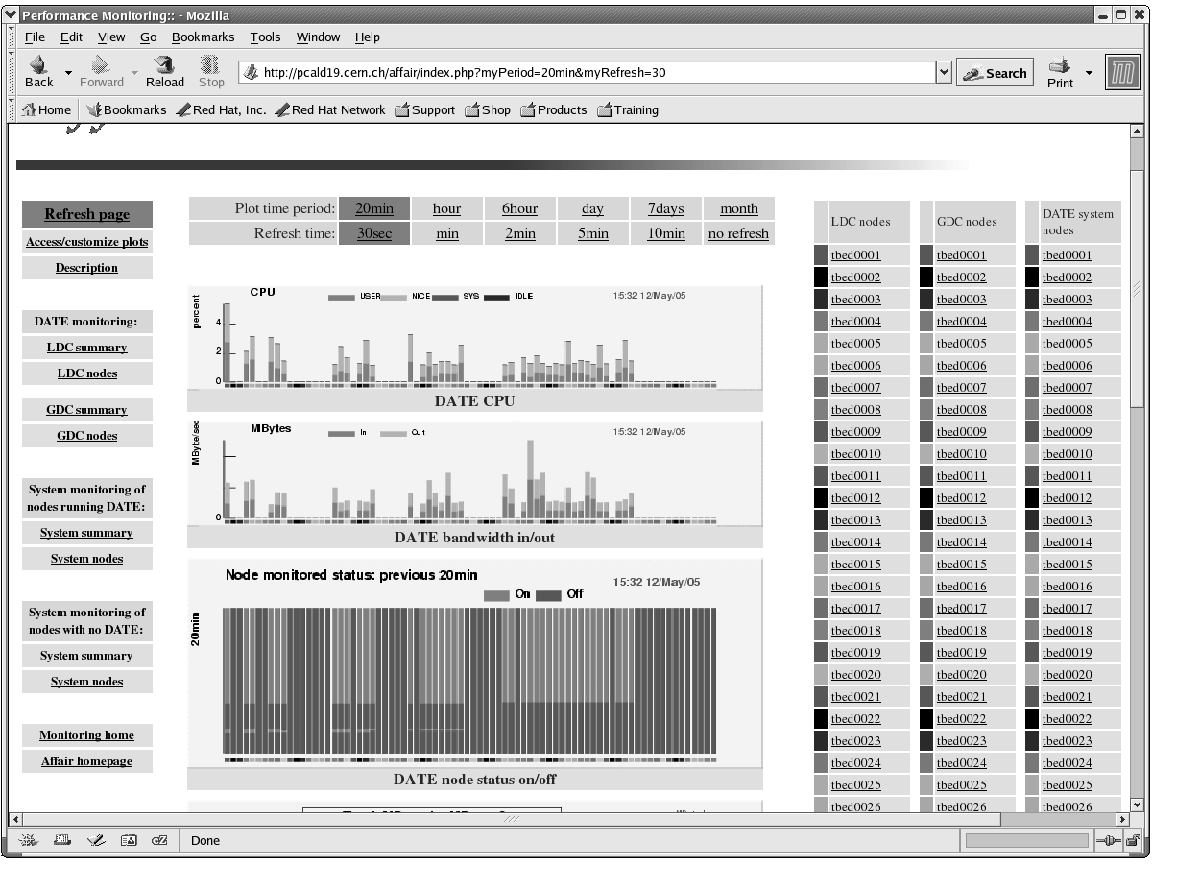
2 Web interfaceThe function of the AFFAIR Web interface is to provide links to plots as well as to performance data. The eps format of the plots created by the Data Processor (see section V.F) is not suitable for Web access, so the Web interface first converts the requested plots to a png format, using a system call to the $AFFAIR_MONITOR/support/convert function. A screenshot of the AFFAIR Web interface top page is shown in Figure 4. The links on the left provide access to summary plots (see section V.C) as well as current performance data in a tabular text format. The links on the right generate detailed plots for each monitored node. There are no histograms in the Web interface as the information from them can not be extracted from the temporary databases (so called round robin databases (RRDs). See section V.G). On each page there is a choice of the available plot time intervals, starting from the previous 20 minutes and going up to the last month. The refresh time of the page can be chosen from the provided time intervals (between 30 seconds and infinity), see Figure 4. Figure 4: Top page of the web interface3 PlotsThe graphs provided by the web interface are of the following types:
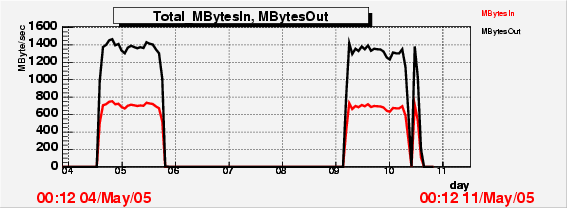
Figure 5:Aggregate in and out transfer rate for the past seven days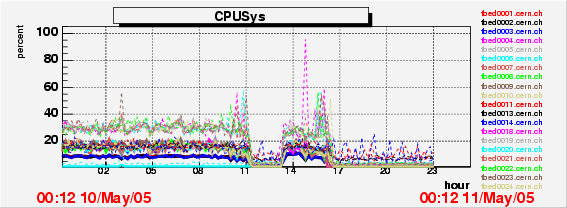
Figure 6:System CPU status for the past day for 20 nodes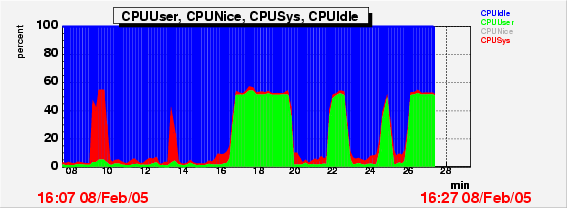
Figure 7:CPU status for the past 20 minutes for one node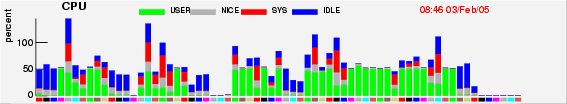
Figure 8:Current CPU status of all nodes. The bottom is color coded to match the node links on the right side of the AFFAIR Web pages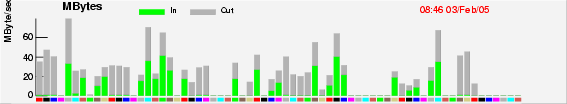
Figure 9:Current in and out transfer rate of all nodes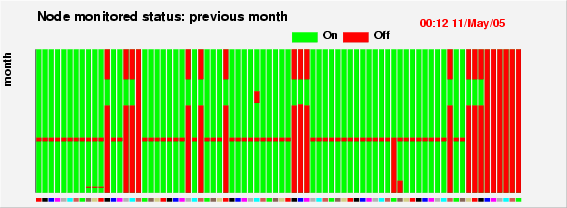
Figure 10:Status of node during the past month4 CollectorsThe Collectors are the processes which gather the performance data on each monitored node. They execute an endless loop, with the period provided by the AFFAIR Monitor. At the end of each loop the data is extracted and sent to the AFFAIR Monitor. The data is obtained in several ways:
5 AFFAIR MonitorThe AFFAIR Monitor is the AFFAIR component on the monitoring station that gets performance data via DIM communication channels and stores it in temporary round robin databases (RRD) as well as in ROOT permanent storage. When the AFFAIR Monitor is started, it reads the file $AFFAIR_MONITOR/config/computerlist.conf to get a list of all the nodes used, and subscribes to the LDC, GDC and DATEMON services on all the nodes. It then sends configuration parameters to the nodes (see section VI.C), and receives back the final parameters used (if the Collector changed them), as well as some system information, like the kernel version, CPU speed or RAM size. Several configuration and log files are updated with this data. The AFFAIR Monitor then continuously receives (with a period specified in the parameters sent to the Collectors) performance data. The data is sent both to the appropriate RRD, and -if offline storage is chosen-, to ROOT storage files. If an RRD and ROOT file does not yet exist for a particular monitored node and monitoring set they will be created on the fly.
6 Data ProcessorThe Data Processor is ROOT based code to create plots for the Web interface and to perform detailed offline analysis of the monitored data. The default behavior of the monitoring station, using the startProcess.sh script, is to create several Data Processor instances (one for each monitored set). The Data Processors loop continuously over all the RRDs, generate global plots and place them in the $AFFAIR_MONITOR/plots directory. The plots are in eps format since this is the ROOT output format. The latencies between cycles depends on the number of nodes, and is usually under 1 minute. There is a number of flags regulating the behavior of the Data Processors in the format -flag=value, as described in table IV.
Table IV: Parameters for the Data Processor
7 Round Robin DatabasesThe Round Robin Databases[5] (RRD) is a very efficient temporary storage mechanism that enables the incoming data to be stored with minimal delay. RRDs work with a fixed amount of data, corresponding to a fixed time deph. The data is structured in rows, with one row for a particular time. The column width is the number of parameters monitored, with each a real number. For every node, each monitoring set has its own RRD, that contains the information shown in table V. The data is always averaged for the given time resolution, which enables only a small amount of data to be read out, making plot creation efficient. The maxima for each row can also be recorded by the RRDs. This feature is used in plotting the maxima as dashed lines, superimposed over the mean values. Of course, for the highest resolution (10 sec in our case) the maxima and mean are the same numbers. As the data is averaged for a particular time resolution, the RRDs can not be used to create histograms. These, however, can be made offline using the permanent data storge. The time resolution can be changed on an existing RRD file by using the rrdtool - tune function (for details see the description of the rrdtool function on the following Web page: http://people.ee.ethz.ch/õetiker/webtools/rrdtool/doc/rrdtool.en.html).
Table V:Relation between the time resolution and the total time depth
8 Directory structureThe AFFAIR code is contained in the $AFFAIR_MONITOR directory and distributed in a directory structure as shown in table VI.
6 Configuration filesThere are several configuration files regulating what is being monitored and what is being plotted. They are all placed in the $AFFAIR_MONITOR/config directory and are described in this section.
1 computerlist.confThis configuration file contains the full list of computers to be monitored in a DATE environment, with one computer name per line. Any new node that will be monitored in a DATE environment should be included in this file. Note that if a node is removed by the runControl, there is no need to remove it from this configuration file. Also, it is important to write the FULL node name, such as pcdaq01.cern.ch (i.e. with cern.ch), as this ensures consistency in DIM service declarations between the Collectors and the AFFAIR Monitor.
2 GDC.conf, LDC.conf, DATEMON.confThese files define which plots are created for the Web server, and how they look (units, scaling, labels,etc). The defaults given with the AFFAIR distribution can be modifed by editing these files. Every monitored variable has a line dedicated to it. The order within the files is the same as the order of the monitored data sent from the nodes. Each of the lines has the parameters presented in table VII. An example is figure 11.
Table VII: Parameters for the GDC.conf, LDC.conf, and DATEMON.conf files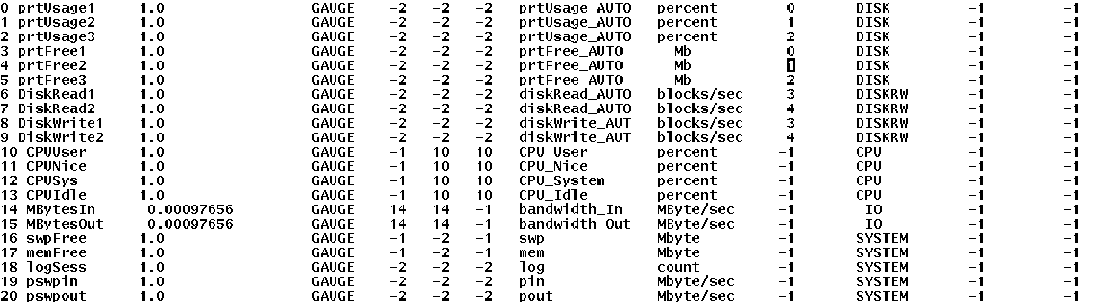
Figure 11:The DATEMON.conf configuration file3 monsetDefault.conf and computers.confThe monsetDefault.conf file provides the default parameters sent by the AFFAIR Monitor to the Collectors, with a line for each monitoring set. If a parameter is set to AUTO, then the Collector will determine its value. For example if the paramater for the ethernet card is set to AUTO, then the Collector will use the card with the largest traffic. The monsetDefault.conf file is also used to control which monitoring set is displayed on the Web and the text that accompanies it. A hash mark on the first space of each line causes the web to ignore this monitoring set. The format in the monsetDefault.conf file is shown in table VIII.
Table VIII:format of the monsetDefault.conf configuration file. In the case of DATEMON, the eight parameters sent correspond to time period,unused, partition name 1 and 2 and 3, disk name 1 and 2, and the ethernet device (see table III ).The final parameters returned from the nodes and used in subsequent AFFAIR running are stored in the computers.conf file, with a separate entry for each monitored node and monitoring set.XXXnode The format in the computers.conf file is shown in table IX. The parameters can be changed (for example, to switch to a less used ethernet card, say from 0 to 1) and they will be used next time either the AFFAIR Monitor or the appropriate Collector starts.
Table IX:format of the computers.conf configuration file7 Offline storage and analysisThe ROOT file is closed and transfered to the $AFFAIR_MONITOR/backup directory after about ten hours of data taking. It is then renamed into a filename indicating the start and end of data taking, as well as the monitored node name and the monitoring set, with the following format:
For example, if a GDC ROOT file for the monitored node pcdaq01.cern.ch was created at 23:52 on the 5th August 2005 and closed at 9:35 on the 6th August, it is named pcdaq01.cern.ch_GDC_23_52_05_Aug_05__09_35_06_Aug_05.root
1 ROOT file interface for the offline analysisThe types of plots accessed online by the Data Processor for a fixed time depth can be created offline for any desired time period by using the generated ROOT files. Table IV explains the different options available. For example, to have an analysis of LDCs for the period between 20:00 on the 5th May and 23:30 on the 8th May:
The assumption is that all the ROOT files are stored or linked in $AFFAIR_MONITOR/backup. The above example creates peformance graphs and places then in the $AFFAIR_MONITOR/plots/user directory. Histograms are now also produced, unlike the Web based graphs. A ROOT file, called user.root, containing all the plots and histograms is placed also in the $AFFAIR_MONITOR/plots/user directory. Global plots are in the top ROOT directory, while individual plots are in the appropriate sub-directory. This file is viewed by typing on the console:
At this point a browser with ROOT files is shown, and by clicking on ``ROOT files'', followed by ``user.root'' and ``LDC'', the plots are accessed.
2 Web interface to offline analysis
Offline analysis can also be achieved using the Web interface, accessed
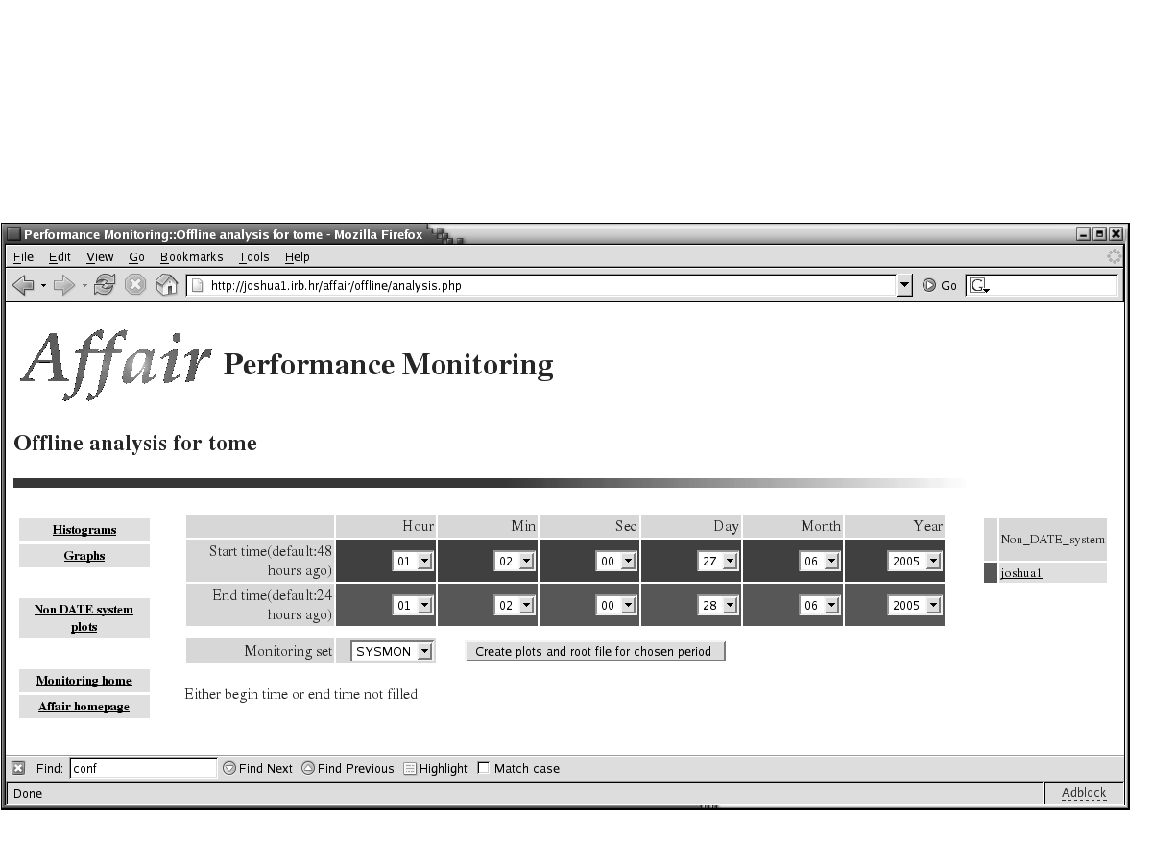
by the The Offline analysis button (figure 12).
Figure 12:Offline analysis interfaceFor security reasons password protection needs to be set up. The procedure consists of several steps. First, in the Apache configuration file httpd.conf (usually in /usr/local/apache/conf) the line AllowOverride None needs to be changed to AllowOverride All. Next, three files need to be created in $AFFAIR_MONITOR/web/offline:
It is necessary to have the full path for the AuthUserFile and AuthGroupFile parameters. The .htgroup file contains the names of the users. For example, if they are Tom, Dick, and Harry, it would be:
The .htpasswd file is created using the htpssswd command. For our example, the procedure would be:
The -c flag is applied only for the first user to create the .htpasswd file.
8 LoggingThe default outputs of AFFAIR Monitor, Data Processor and Collector are sent to stdout. In the cron jobs examples given above all the outputs are sent to /dev/null. This can instead be redirected to any logfile, as the following example shows for the Data Processor:
A much more verbose output is achieved by adding the verbose option as the last parameter of any $AFFAIR_MONITOR/startProcess.sh call.
9 UpgradeAFFAIR may be upgraded independently of DATE. Unpacking the file affairMonitorNEWVERSION.tar.gz in the $AFFAIR_MONITOR directory and running make does not overwrite existing configuration files and databases.
Bibliography |