03 May 12 - this page is part of our archive. View our latest results
Introduction
The global fit to electroweak precision data routinely performed by the LEP electroweak working group and others, demonstrates impressively the predictive power of electroweak unification and quantum loop corrections. We have performed the fit using the most recent experimental measurements and state-of-the-art SM predictions. Note: Results/Plots presented on this page include latest results until may 2012:- new W mass combination from Tevatron and LEP MW=80.385±0.015 GeV
- considering latest results from Higgs searches at the LHC and Tevaron: ATLAS , CMS, and Tevatron!
- complete 3NLO QCD corrections to hadronic Z width implemeted (P. A. Baikov et al., arXiv:1201.5804).
- Implementation of electroweak two-loop corrections to Rb (Freitas and Huang, arXiv:1205.0299). Note: Now the prediction is less compatible with the measurement than before.
Theoretical predictions
For the following results the latest theoretical predictions of electroweak observables are used. In particular:
- The mass of the W boson (MW) is calculated with the full two-loop corrections and known beyond-two-loop corrections from
(M. Awramik et al., Phys. Rev. D69, 053006 (2004), hep-ph/0311148). - The effective weak mixing angle (sin2θeffl) is calculated with the full two-loop corrections and known beyond-two-loop corrections from
(M. Awramik et al., JHEP 11, 048 (2006), hep-ph/0608099)
(M. Awramik et al., Nucl.Phys.B813:174-187 (2009), arXiv:0811.1364). - The partial and total widths of the Z and of the total width of the W boson make use of the parametrizations of (Cho et. al, arXiv:1104.1769, see also older papers 1, 2, 3). Small additional correction factors, determined from a comparison with the Fortran ZFITTER package (1, 2), are used for MH > 200 GeV.
- The determination of the strong coupling makes use of the complete fourth-order (3NLO) calculation of the hadronic Z width (P. A. Baikov et al., arXiv:1201.5804) .
- Electroweak two-loop corrections to Rb (Freitas and Huang, arXiv:1205.0299).
The free fit parameters in the Gfitter global electroweak Standard Model fit are:
- MZ : the mass of the Z boson
- MH : the mass of the Higgs boson
- Δαhad(MZ2) : the five-quark hadronic contribution to the running QED coupling constant
- αS(MZ2) : the strong coupling constant
- mt : the mass of the top quark
- mc and mb : the running MS-bar masses of the c and b quarks
- 2 parameters to account for theoretical uncertainties on MW and sin2θeffl.
Experimental input and fit results for the current global fit
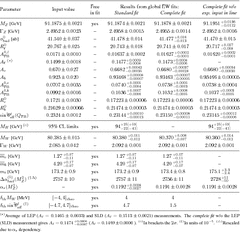
In the following tables and figures the experimental input used in the fit and the fit results are given. All fits discussed here minimise the test statistics χ2 which accounts for the deviations between the observables given in the table below and their SM predictions (including correlations). Out of the ensemble of the model parameters the following are free to vary in the fit: MZ, MH, mc, mb, mt, Δαhad(MZ2), αs(MZ2) and four theoretical error parameters, accounting for theoretical uncertainties. We perform the global electroweak fits in two versions:- the standard (``blue-band'') fit, which includes all the observables listed in the Table below, except for results from the direct Higgs searches.
- Note: change in convention for the complete fit! The complete fit considers the direct Higgs searches from LEP, Tevaron, and the LHC, i.e. the Higgs mass can take only values which are not excluded at the 95% CL (no likelihood information used).
| Table: Input values and fit results for parameters of the global electroweak fit. The first and second columns list respectively the observables/parameters used in the fit, and their experimental values or theoretical estimates. The subscript ``theo'' labels theoretical error ranges. The third column indicates whether a parameter is floating in the fit. The fourth (fifth) column quotes the results of the standard ( complete) fit not including (including) the constraints from the direct Higgs searches at LEP and Tevatron in the fit. The last column gives the fit results for each parameter without using the corresponding experimental constraint in the fit (indirect determination). |
 .eps
.eps
|
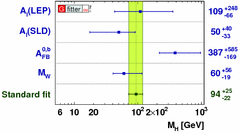
| Comparing fit results with direct measurements: pull values for the complete fit (left) and results for MH from the standard fit excluding the respective measurements (right). |
 .eps
.eps
 .eps
.eps
|
| Determination of MH excluding all the sensitive observables from the standard fit, except for the one given. |
 .eps
.eps
|
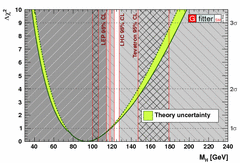
| Δχ2 as a function of MH for the standard fit. The solid (dashed) line gives the results when including (ignoring) theoretical errors. |
 .eps
.eps
|
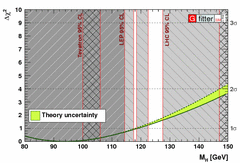
| Δχ2 as a function of MH for the standard fit (Zoom). The solid (dashed) line gives the results when including (ignoring) theoretical errors. |
 .eps
.eps
|
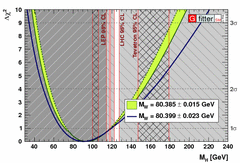
| Δχ2 as a function of MH for the standard fit. The figure shows the impact on the Higgs mass from the new W mass world average. |
 .eps
.eps
|
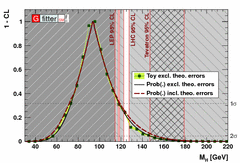
| The (1-CL) function derived from the Δχ2 estimator versus the MH hypothesis. Compared are the Gaussian approximation Prob(Δχ2,1) for the standard fit with (dashed/red line) and without theoretical errors (solid/black line), respectively, to an evaluation based on toy MC simulation for which theoretical errors have been ignored. |
 .eps
.eps
|
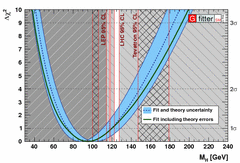
| Δχ2 as a function of MH with an alternative treatment of theory uncertainties. Shown are the results of a standard fit ignoring theoretical uncertainties (solid line), the regions determined from the maximum deviation in Δχ2 achieved by shifting the SM predictions of all observables according to one standard deviation of the various theory uncertainties (shaded band) and for comparison the result of the standard fit (dashed curve) in which theoretical uncertainties are included in the χ2 calculation. |
 .eps
.eps
|
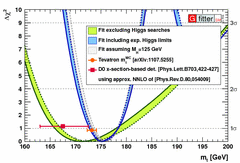
| Δχ2 versus mt for the complete fit (solid line) and the standard fit (dashed), both excluding the mt determinations indicating by the dots with 1σ error bars. Also shown the result for hypthetical Higgs discovery at 125 GeV. |
 .eps
.eps
|
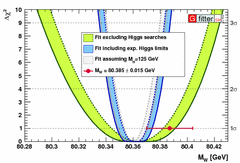
| Δχ2 versus MW for the complete fit (solid line) and the standard fit (dashed), both excluding the MW world average indicating by the dot with 1σ error bars. Also shown the result for hypthetical Higgs discovery at 125 GeV. |
 .eps
.eps
|
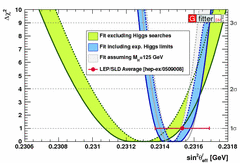
| Δχ2 versus the effective weak mixing for the complete fit (solid line) and the standard fit (dashed), both excluding all precision observables sensitive to sin2&thetatheta;eff. The dot with 1σ error bars indicates the LEP/SLD averagee. Also shown the result for hypthetical Higgs discovery at 125 GeV. |
 .eps
.eps
|
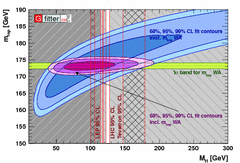
| Contours of 68%, 95% and 99% CL obtained from scans of fits with fixed variable pairs mt vs. MH . The largest/blue (narrower/purple) allowed regions are the results of the standard fit excluding (including) the measurements of mt. The horizontal bands indicate the 1σ regions of the current world avergage of mt measurements. |
 .eps
.eps
|
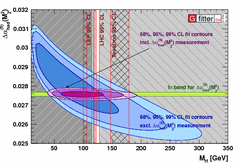
| Contours of 68%, 95% and 99% CL obtained from scans of fits with fixed variable pairs Δαhad(MZ2) vs. MH. The largest/blue (narrower/purple) allowed regions are the results of the standard fit excluding (including) the measurements of Δαhad(MZ2). The horizontal bands indicate the 1σ regions of the Δαhad(MZ2) phenomenological determination. |
 .eps
.eps
|
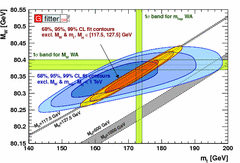
| Contours of 68%, 95% and 99% CL obtained from scans of fits with fixed variable pairs MW vs. mt. The largest/blue (narrower/yellow) allowed regions are the results of the standard fit for free floating Higgs mass (Higgs mass constrained to 117.5-127.5 GeV). The grey shaded array shows the prediction of the masses as a function of the Higgs mass. The horizontal bands indicate the 1σ regions of measurements (world averages). |
 .eps
.eps
|

Probing the Standard Model
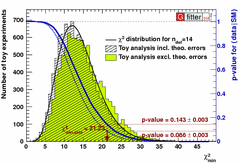
We evaluate the p-value of the global SM fit using a toy MC simulation with 10000 experiments, These are generated using as true values for the SM parameters the outcomes of the global fit. For each toy simulation, the central values of all of the observables used in the fit are generated according to Gaussian distributions around their expected SM values (given the parameter settings) with standard deviations equal to the full experimental errors taking into account all correlations. Fair agreement is observed between the empirical toy MC distribution and the χ2 function expected for Gaussian observables.| Result of the MC toy analysis of the complete fit. Shown are the χ2min distribution of a toy MC simulation (open histogram), the corresponding distribution for a complete fit ignoring theoretical errors (shaded/green histogram), an ideal χ2 distribution assuming a Gaussian case with ndof=14 (black line) and the p-value as a function of the χ2min of the global fit. |
 .eps
.eps
|
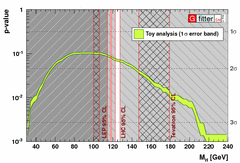
| P-value of the electroweak fit versus MH as obtained from toy MC simulation. The error band represents the statistical error from the MC sampling. |
 .eps
.eps
|
