Visualization of FLUKA voxel geometries with DaVis3D |
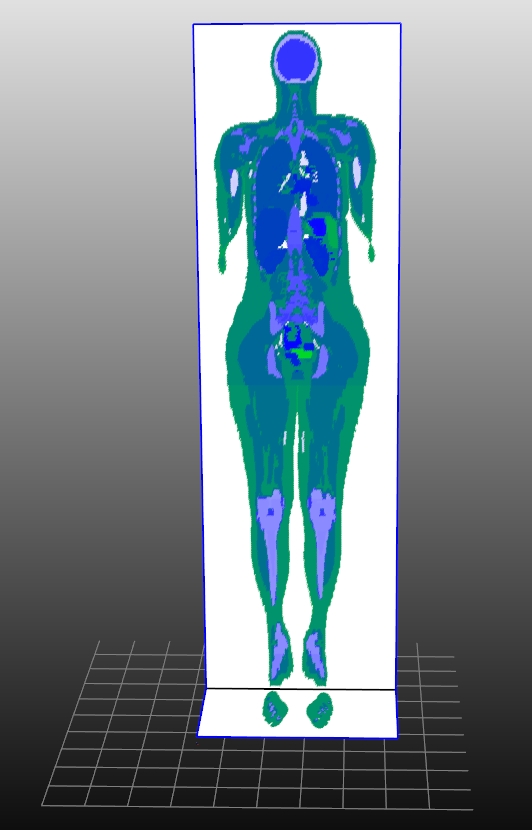
Using the DaVis3D plugin it is possible to interactively visualize 2D cuts of FLUKA voxel geometries. The latest version of the plugin allows for direct reading of FLUKA's binary "VXL" files. Consequently, three different planes can be enabled to visualze sections through the voxel data. By moving the sliders these sections can be adapted interactively. In addition it is possible change the color coding as well as emphasize thresholds based on data values the represent various types of tissue.
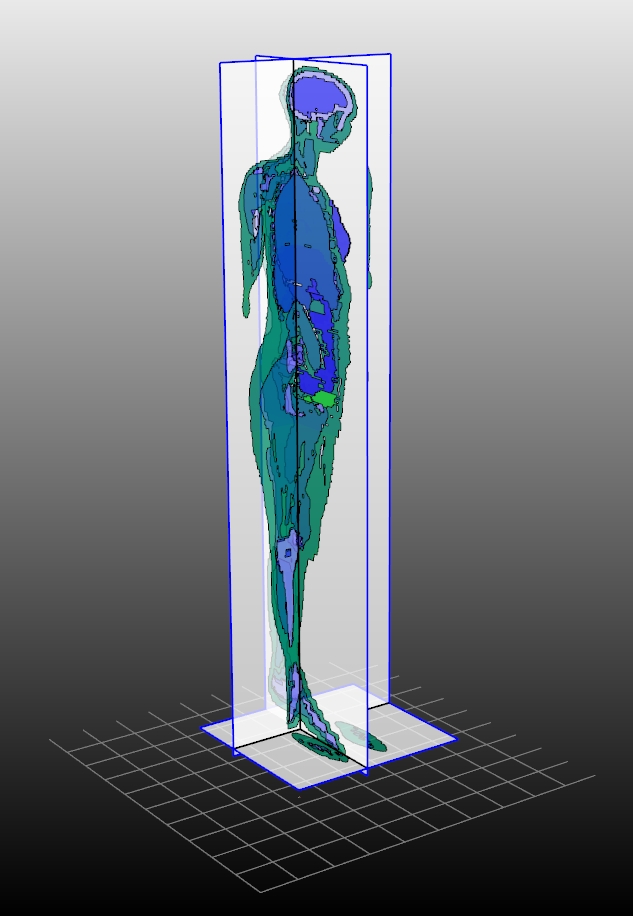
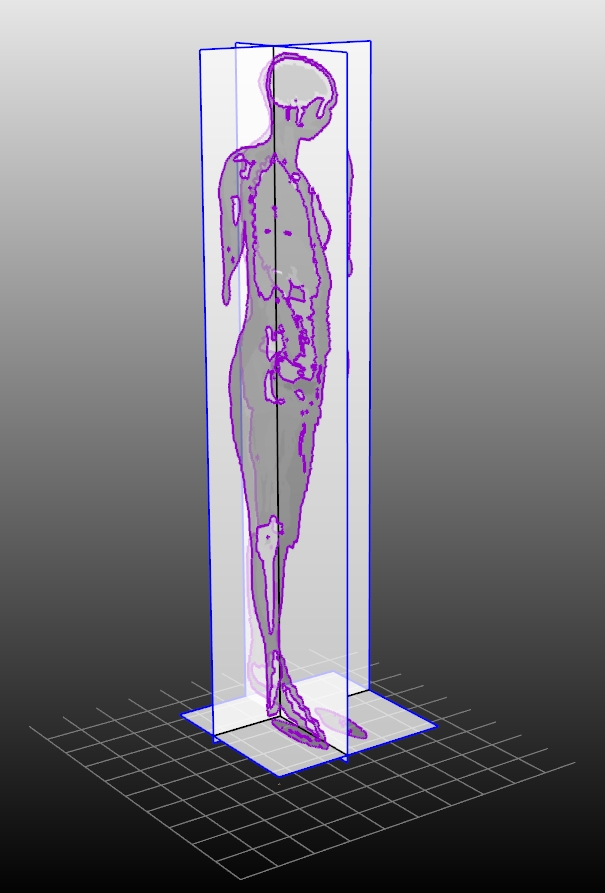
Segmented CT data courtesy of: ICRP Publication 110: Adult Reference Computational Phantoms, Annals of the ICPR Volume 39 Issue 2, ISBN 13: 978-0-7020-4186-0, November 2009, Elsevier
Visualizing voxel geometries + calculation results
Usually DaVis3D is used to display sections through calculation results on top of the CSG geometry. As the voxel data are also displayed in terms of 2D sections and not modelled as CSG data a slightly different approach has to be used as SimpleGeo's native CSG renderer cannot be applied. The basic idea is to use two (or more) instances of DaVis3D simultaneously with one being used to display the voxel geometry and the other one to display the data. Therefore, the user simply creates one or more copies of the VDaVis3D.plx file in the directory where all the plugins are located. As a consequence it is possible to load multiple instances of DaVis3D simultanteously. One of these instances can be used to load & display the voxel data whereas the other one(s) to display the simulation data.
In case the section of the voxel geometry is fully co-planar with a section of the results then so called "color-bleeding" artifacts might occur in the visualization as it is not possible to uniquely determine which section is on top. This can be solved by simply shifting one of sets by a small offset. In order to do this one can define a translation of the origin for each DaVis3D plugin in the settings dialog (right mouse-click on the title of the DaVis3D dialog --> select "Settings..." in the system menu. In the settings dialog an arbitrary transformation matrix can be defined which is automatically applied to all the data visualized by the respective instance of DaVis3D).
For further details on how to change the color table, emphasize thresholds etc. please see the DaVis3D section in SimpleGeo's manual.