ATLAS Beam Backgrounds
Introduction
This page is intended to include up-to-date information useful for Luminosity / Beam Conditions / Forward Detectors (LBCF) shifters related to the beam background monitoring tools.Beam background panels
Beam backgrounds and luminosity are relevant features of the run conditions. The ATLAS detector has several monitors that help distinguish between normal collisions and background events. Some of these detectors also contribute to the luminosity determination. Different monitoring tools are available to provide checks on the beam backgrounds and the quality of the data collected: 1) Beam crossing identifier (BCID)-blind background displays 2) Bunch-by-bunch beam conditions diagnostic displays (they will become active in the near future and will be explained then)BCID-blind background displays
The BCID-blind background displays are part of the Detector Control System (DCS) and are organized hierarchically in a tree structure. In the top level panel "ATLAS Backgrounds" there are two tabs with background history plots (known in PVSS jargon as "trending plots"), placed in this prominent position for its relevance in the current operating conditions, with:- absolute values
- normalized values (the ones sent to the LHC)
- Beam Conditions Monitor (BCM)
- Liquid Argon calorimeters (LAr)
- Minimum Bias Trigger Scintillator (MBTS)
- ATLAS Beam Loss Monitors (BLM)
- Beam Conditions Monitor (BCM)
- ATLAS Beam Loss Monitors (BLM)
- Minimum Bias Trigger Scintillator (MBTS)
- Luminosity Cerenkov Integrating Detector (LUCID)
- Level-1 calorimeter (L1 Calo)
- Zero Degree Calorimeter (ZDC)
- Pixel occupancy
- Semiconductor Tracker (SCT) space points
- Transition Radiation Tracker (TRT) occupancy
- Tile calorimeter (Tilecal)
- Minimum Bias Trigger Scintillator (MBTS)
- Forward calorimeters (FCAL)
- Forward Monitored Drift Tubes (MDT) chambers
- Thin Gap Chambers (TGC)
Timing and bunch-by-bunch background diagnostics
To explain in a near future.Path to the panels
To see the beam background panels on the LBCF desk computer screens follow the instructions: 1) The top level page for the LHC Finite State Machine (FSM):- Click on the LBC button, on the tool bar of the leftmost computer screen, and on Beam Conditions DCS
- The ATL_FORWARD:fwUiAtlasFrame window will pop up
- Find the LHC box on the top of the window and click on LHC to get LHC and BEAM PARAMETERS. This brings up the LHC navigation panels:
-- LHC INTERFACES
-- INSTRUMENTATION
-- ATL_BACKGROUNDS
-- Luminosity
-- Luminous region
- Click on the ATL_BACKGROUNDS navigation panel to get information on the "Beam Halo", "ID Occupancies & Dead Time" and "Forward Detectors Hit Rates"
- A button like this
 on the right side above the history plots, allows to commute between absolute and normalized values
- The ATL_BACKGROUNDS brings up the following navigation panels:
-- BEAM_HALO
-- ATLAS HIT RATES
-- CALO_CURRENTS
-- MUON_CURRENTS
- In each of those navigation panels are sub-branches and we can navigate further down
- If the "No panel available" appears, this means that the display is under development, being available soon
Detailed description of beam-condition history displays
ATLAS BACKGROUNDS
In every display the y axis are shown simultaneously in a Grey box and can be modified by the roller button of the mouse. The x axis can present different time ranges.
Halo (A + C)
Time of flight measurements with two detector stations, one at each side of the ATLAS detector, are used to distinguish between interactions and background (beam gas, halo, scraping on the TCT collimators). Particles originating in the interaction point arrive at the same time at the two stations, and therefore form an in-time coincidence, and particles from the background are out-of-time, since they reach the station on the incoming beam side earlier then the interaction point.
The following plot is a distribution of time difference between hits on side A (z > 0) and hits on side C (z < 0) in the same event, in the BCM stations, during the 2009 run. Collisions as well as background due to beam 1 and beam 2 are clearly visible.
 Other subdetectors (MBTS, LAr, BLM) also have this ability to distinguish between signal and background; these plots are available at the LBCF desk as part of the timing and bunch-by-bunch diagnostics, discussed later in this document.
 The plot shows the rate of particles that are out-of-time. This particular plot shows the ATLAS BLMs rates during a run with cosmics. The time granularity at which the data is accumulated is 320 us and what is shown is the sum of data from the stations in side A and side C.
Monitored for BCM, MBTS and LAr: Out-of-time hits
The plot shows the rate of particles that are out-of-time. This particular plot shows the ATLAS BLMs rates during a run with cosmics. The time granularity at which the data is accumulated is 320 us and what is shown is the sum of data from the stations in side A and side C.
Monitored for BCM, MBTS and LAr: Out-of-time hits Monitored for BLMs: Leakage current
Units: Hz
Trigger requirements: free running (independent from the ATLAS trigger)
Typical 'good' levels: depends on the beam conditions
Typical 'warning' levels: to define but it is expected a very small fraction of background events when the beam is "clean"
ID Occupancies & Dead Time

The plot shows, as different colour trend lines, the TRT occupancy, averaged over all straws, and the total SCT space points, built from cluster pairs from the opposite sides of a given module, or from separate modules which overlap in eta or in phi. The TRT occupancy is counted by looking at straws with long Time Over Threshold (TOT), which reduces the noise, by almost two orders of magnitude, while still being sensitive to any particle fluxes. The fluctuations observed, in this case, are due essentially to beam halo fluctuations. The plot is updated every second. Every entry is an average over 10 events. Displays of the Pixel occupancy and total dead time are in preparation. Monitored: Pixel and TRT total occupancies (1 means 100% occupancy), total SCT space points and total dead time (1 means 100% dead time)
Units: dimensionless
Trigger requirements for SCT/TRT: any event in the beam pick-up detectors (BPTX) stream; if we are taking cosmics, no requirements are made
Trigger requirements for Pixel: to be determined
Trigger requirements for Dead Time: to be determined
Typical 'good' levels for SCT/TRT: TRT occupancy ~ 0.5%; SCT space points = 100 - 500
Typical 'good' levels for Pixel: to be determined
Typical 'good' levels for Dead Time: to be determined
Typical 'warning' levels for SCT/TRT: to be determined
Typical 'warning' levels for Pixel: to be determined
Typical 'warning' levels for Dead Time: to be determined
Forward Detectors' Hit Rates (A + C)

The plot shows the total hit rates for LUCID. There are two detectors installed, one in side A and the other in side C of the ATLAS detector, in the end-cap region. The A + C hit rate is a simple sum of the two individual side rates, without any external trigger or timing requirement. In the absence of beam, the hit rates mostly reflect cosmic muons traversing the quartz window of the LUCID photomultiplier and are typically inferior to 1Hz. Rates of a few hundred Hz, with a regular time structure, are visible during LUCID calibration. When the beam conditions are "clean", the hit rate is dominated by the luminosity, as we see here. However, if the beam conditions are not optimal, the hit rate will be dominated by backgrounds, as can be seen in the following plot taken during an aperture scan.
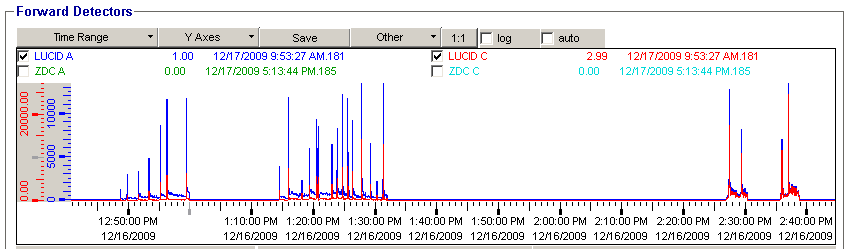 Hit rates for ZDC are equally available. The ZDC doesn't "see" cosmic muons since it is localized to deep in the tunnel. Rates of a few Hz, with a regular structure, are visible during ZDC calibration.
Monitored: LUCID and ZDC total hit rates
Hit rates for ZDC are equally available. The ZDC doesn't "see" cosmic muons since it is localized to deep in the tunnel. Rates of a few Hz, with a regular structure, are visible during ZDC calibration.
Monitored: LUCID and ZDC total hit ratesUnits: Hz
Trigger requirement: free running (independent of the ATLAS trigger)
Typical 'good' levels: depends on the luminosity signal
Typical 'warning' levels: any signal that is much larger than the luminosity signal (more than the double of the luminosity signal)
ATLAS Normalized Beam Backgrounds
Collision (BKGD1, BLM) & Halo (BKGD2)
 History display of BKGD1, defined as 100 * (TRT occupancy / Danger Level), BKGD2, defined as 100 * (BCM Halo / Danger Level), and ATLAS BLM rates A + C. The Danger Level is 0.30 (30%) for BKGD1, corresponding to the expected TRT occupancy at nominal LHC luminosity. The Danger Level for BKGD2 is still to define. If BKGD1 or BKGD2 are above 50%, the beam is very "dirty".
Monitored: BKGD1, BKGD2 and ATLAS BLM rates
History display of BKGD1, defined as 100 * (TRT occupancy / Danger Level), BKGD2, defined as 100 * (BCM Halo / Danger Level), and ATLAS BLM rates A + C. The Danger Level is 0.30 (30%) for BKGD1, corresponding to the expected TRT occupancy at nominal LHC luminosity. The Danger Level for BKGD2 is still to define. If BKGD1 or BKGD2 are above 50%, the beam is very "dirty".
Monitored: BKGD1, BKGD2 and ATLAS BLM rates Units for BLM rates: Hz (the others are dimensionless)
Trigger requirement for BKGD1: any event in the beam pick-up detectors (BPTX) stream; if we are taking cosmics, no requirements are made
Trigger requirement for BKGD2: to be determined
Typical 'good' levels for BKGD1 and BKGD2: to be determined
Typical 'good' levels for BLM rates: to be determined
Typical 'warning' levels for BKGD1 and BKGD2: 50%
Typical 'warning' levels for BLM rates: to be determined
Abort Level & Dead Time
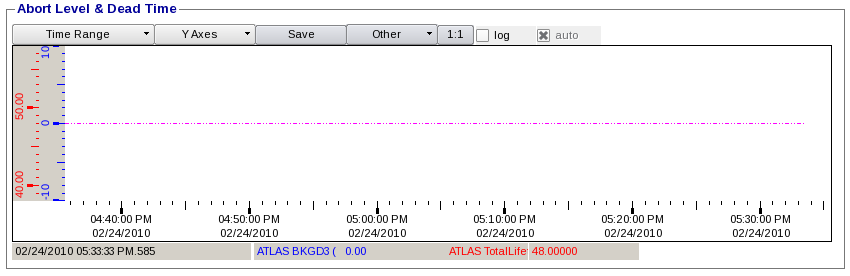 History display of Abort Level and Dead Time. The Abort Level is defined as the fraction of BCM abort threshold. If the Abort Level is close to 50% we are about to abort.
Monitored: Abort Level and Dead Time
History display of Abort Level and Dead Time. The Abort Level is defined as the fraction of BCM abort threshold. If the Abort Level is close to 50% we are about to abort.
Monitored: Abort Level and Dead Time Units for Dead Time: dimensionless (1 means 100%)
Trigger requirement: full ATLAS trigger menu
Typical 'good' levels: to be determined
Typical 'warning' levels: to be determined
Beam Currents & Inverse Lifetimes
 History display of the two beam currents, B1 and B2, and inverse lifetimes of the beams. The beam current measurement is provided by DC current transformers (DCCT), which measure the total current (bunched and unbunched). The inverse lifetimes of the beams are directly proportional to the beam loss rate, giving the indication of the overall background level around the machine as a whole.
Monitored: Beam currents and inverse lifetimes
History display of the two beam currents, B1 and B2, and inverse lifetimes of the beams. The beam current measurement is provided by DC current transformers (DCCT), which measure the total current (bunched and unbunched). The inverse lifetimes of the beams are directly proportional to the beam loss rate, giving the indication of the overall background level around the machine as a whole.
Monitored: Beam currents and inverse lifetimes Units for beam curresnts: *e11 protons
Units for inverse lifetimes: to be determined
Trigger requirement: no trigger requirements
Typical 'good' levels: to be determined
Typical 'warning' levels: to be determined
BEAM HALO
BCM Halo Rates
 History display of the rate of out-of-time hits in each one of the BCM stations, side A and side C. Secondary particles from collisions will reach both BCM stations at the same time, while particles from upstream background interactions reach the nearest station 12.5 ns before the secondary particles from collisions (6 ns before collisions). So out-of-time hits are used to identify background events and in-time coincidence hits to monitor luminosity.
Monitored: Out-of-time hits in the BCM
History display of the rate of out-of-time hits in each one of the BCM stations, side A and side C. Secondary particles from collisions will reach both BCM stations at the same time, while particles from upstream background interactions reach the nearest station 12.5 ns before the secondary particles from collisions (6 ns before collisions). So out-of-time hits are used to identify background events and in-time coincidence hits to monitor luminosity.
Monitored: Out-of-time hits in the BCM Units: Hz
Trigger requirement: BCM is self triggered gated on the bunches
Typical 'good' levels: depends on the beam conditions
Typical 'warning' levels: to define but it is expected a very small fraction of background events when the beam is "clean"
MBTS & LAr Halo Rates
 History display of the rate of out-of-time hits in each one of the MBTS and LAr stations, side A and side C.
Monitored: Out-of-time hits in MBTS and LAr
History display of the rate of out-of-time hits in each one of the MBTS and LAr stations, side A and side C.
Monitored: Out-of-time hits in MBTS and LAr Units: Hz
Trigger requirement: to be determined
Typical 'good' levels: to be determined
Typical 'warning' levels: to be determined
Halo Fractions (A + C / All)
 History display of the fraction of out-of-time hits in BCM, MBTS and LAr, normalized to the total rate (out-of-time and in-time coincidence).
Monitored: fraction of out-of-time hits
History display of the fraction of out-of-time hits in BCM, MBTS and LAr, normalized to the total rate (out-of-time and in-time coincidence).
Monitored: fraction of out-of-time hits Units: dimensionless (1 means 100%)
Trigger requirement: BCM is self triggered
Typical 'good' levels: to be determined
Typical 'warning' levels: to be determined
ATLAS HIT RATES
BCM & BLM
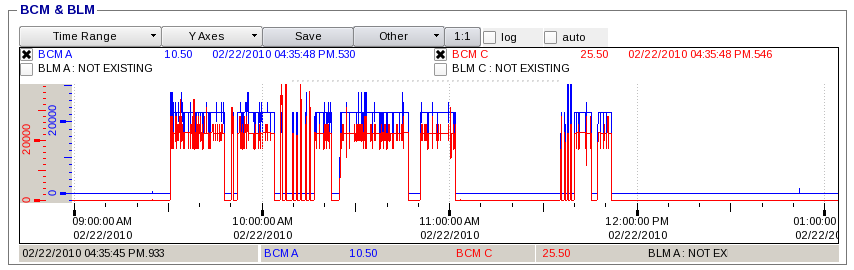 The plot shows hit rates for each one of the MBTS stations, side A and side C, sampled at 1 Hz, without external trigger or timing requirements.
Monitored: BCM hit rates
The plot shows hit rates for each one of the MBTS stations, side A and side C, sampled at 1 Hz, without external trigger or timing requirements.
Monitored: BCM hit rates Units: Hz
Trigger requirement: no trigger requirements
Typical 'good' levels: to be determined
Typical 'warning' levels: to be determined
MBTS & L1Calo
 History display of MBTS hit rates and level-1 trigger information based on the calorimeters, sampled at 1Hz, without any external trigger or timing requirement. MBTS hit rates are dominated by luminosity, as can be seen.
At the very low luminosities achieved so far, the randomly sampled L1 Calo rate is dominated by noise.
Monitored: MBTS and L1Calo rates
History display of MBTS hit rates and level-1 trigger information based on the calorimeters, sampled at 1Hz, without any external trigger or timing requirement. MBTS hit rates are dominated by luminosity, as can be seen.
At the very low luminosities achieved so far, the randomly sampled L1 Calo rate is dominated by noise.
Monitored: MBTS and L1Calo rates Units: Hz
Trigger requirement for MBTS: sampled at 1Hz
Trigger requirement for L1Calo: to be determined
Typical 'good' levels: to be determined
Typical 'warning' levels: to be determined
Forward Detectors
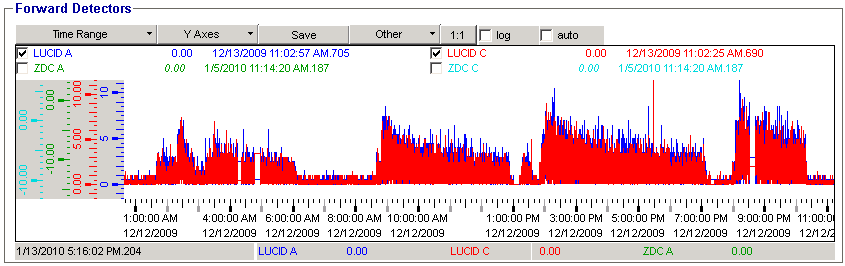 History display of rates for LUCID and ZDC stations. The hit rates are dominated by the luminosity during normal beam conditions. However, they are sensitive to background when beam conditions are bad.
Monitored: LUCID and ZDC single-paddle rates
History display of rates for LUCID and ZDC stations. The hit rates are dominated by the luminosity during normal beam conditions. However, they are sensitive to background when beam conditions are bad.
Monitored: LUCID and ZDC single-paddle rates Units: Hz
Trigger requirement: free running (independent of the ATLAS trigger)
Typical 'good' levels: depends on the luminosity signal
Typical 'warning' levels: any signal that is much larger than the luminosity signal (more than the double of the luminosity signal)
CALO CURRENTS
The amount of current that is needed to supply to the PMTs and the electrodes of the LAr calorimeter is proportional to the number of charged particles detected. So we can try to use the supplied currents to monitor beam conditions.
In the 2009 run was not seen any sensibility from the calorimeter currents to the beam conditions.
Tile
 The current is integrated at the output of a 3-1 card.
Monitored: Current supplied to the PMTs
The current is integrated at the output of a 3-1 card.
Monitored: Current supplied to the PMTs Units: nA
Typical 'good' levels: to be determined
Typical 'warning' levels: to be determined
MBTS
 The current is integrated at the output of a 3-1 card.
Monitored: Current supplied to the PMTs
The current is integrated at the output of a 3-1 card.
Monitored: Current supplied to the PMTs Units: nA
Typical 'good' levels: to be determined
Typical 'warning' levels: to be determined
FCAL
 Monitored: Current supplied to the electrodes
 Units:
Typical 'good' levels:
Typical 'warning' levels:
MUON CURRENTS
The amount of current that is needed to supply to the electrodes of the muon chambers is proportional to the number of charged particles detected. So we can try to use the supplied currents to monitor beam conditions.
In the 2009 run was not seen any sensibility from the muon chambers currents to the beam conditions.
Forward MDT's
 Monitored: Current supplied to the electrodes
 Units:
Typical 'good' levels:
Typical 'warning' levels:
TGC HR
 Monitored: Current supplied to the electrodes
 Units: uA
Typical 'good' levels: less than 15 uA
Typical 'warning' levels: 15 uA
TGC LR
 Monitored: Current supplied to the electrodes
 Units: uA
Typical 'good' levels: less than 15 uA
Typical 'warning' levels: 15 uA
Detailed description of timing and bunch-by-bunch beam conditions diagnostics
To explain in a near future.

Topic revision: r28 - 2010-02-25 - AlbertoPalma
Webs
- ABATBEA
- ACPP
- ADCgroup
- AEGIS
- AfricaMap
- AgileInfrastructure
- ALICE
- AliceEbyE
- AliceSPD
- AliceSSD
- AliceTOF
- AliFemto
- ALPHA
- Altair
- ArdaGrid
- ASACUSA
- AthenaFCalTBAna
- Atlas
- AtlasLBNL
- AXIALPET
- CAE
- CALICE
- CDS
- CENF
- CERNSearch
- CLIC
- Cloud
- CloudServices
- CMS
- Controls
- CTA
- CvmFS
- DB
- DefaultWeb
- DESgroup
- DPHEP
- DM-LHC
- DSSGroup
- EGEE
- EgeePtf
- ELFms
- EMI
- ETICS
- FIOgroup
- FlukaTeam
- Frontier
- Gaudi
- GeneratorServices
- GuidesInfo
- HardwareLabs
- HCC
- HEPIX
- ILCBDSColl
- ILCTPC
- IMWG
- Inspire
- IPv6
- IT
- ItCommTeam
- ITCoord
- ITdeptTechForum
- ITDRP
- ITGT
- ITSDC
- LAr
- LCG
- LCGAAWorkbook
- Leade
- LHCAccess
- LHCAtHome
- LHCb
- LHCgas
- LHCONE
- LHCOPN
- LinuxSupport
- Main
- Medipix
- Messaging
- MPGD
- NA49
- NA61
- NA62
- NTOF
- Openlab
- PDBService
- Persistency
- PESgroup
- Plugins
- PSAccess
- PSBUpgrade
- R2Eproject
- RCTF
- RD42
- RFCond12
- RFLowLevel
- ROXIE
- Sandbox
- SocialActivities
- SPI
- SRMDev
- SSM
- Student
- SuperComputing
- Support
- SwfCatalogue
- TMVA
- TOTEM
- TWiki
- UNOSAT
- Virtualization
- VOBox
- WITCH
- XTCA
Welcome Guest Login or Register
 |
|
or Ideas, requests, problems regarding TWiki? use Discourse or Send feedback