TWiki> Main Web>MyTopics>OnlineMonitoringSystemOMSTutorial (2020-06-23, AivarasSilale)
 EditAttachPDF
Online Monitoring System (OMS)
The CMS Online Monitoring system (OMS) is an upgrade and successor to the CMS Web-Based Monitoring (WBM) system, which is an essential tool for shift crew members, detector subsystem experts, operations coordinators, and those performing physics analyses.OMS instances
The application has two instances:- Production: https://cmsoms.cern.ch/

- Development: https://cmsomsdet.cern.ch/
Grants to edit OMS workspaces
Grants to edit production OMS
In order to edit OMS pages for specific workspaces, you have to be granted by username or by e-group.- Tracker - cms-tracker-OMScustomization
- HGCAL - cms-hgcal-database-oms-edit-access
Grants to edit development OMS
User has to send headers to OMS. We recommend to use browser extension - ModHeader. Headers: Adfs-Login asilale Adfs-Fullname User name and Last nameOMS Tutorial
OMS structure
It is important to understand the structure of OMS.- Workspace top-level container defines organizational unit, sub-detector, etc.
- Folder lower-level container contains Pages organized by context.
- Page lowest-level content container contains one or more Portlets.
- Controller - (optional) component allows the user to filter the result set.
- Portlet - a content presentation

Controller
The controller allows the user to filter data. But controllers have to be created by developers. Users can just reuse controllers. It is important to understand, that controller use selectors.- Selector - one or multiple parameters that the main purpose to filter data. The user has to create selectors (elements which will be selected in the controller and transferred into portlets to filter data).
Selectors
First of all, the user has to create selectors as shown below. He has to fill all the necessary fields and select the type of selector.
Controller Component
When selectors are created the next step is to create Controller Component. The component name has to be the same as the controller written in code. In our example MyExampleController. Below the Component name, the user can write the description of the component configuration. At this moment we don't have generic component with configuration with all details. In the example just shown that user let other users know that this controller component requires to describe resthub URL.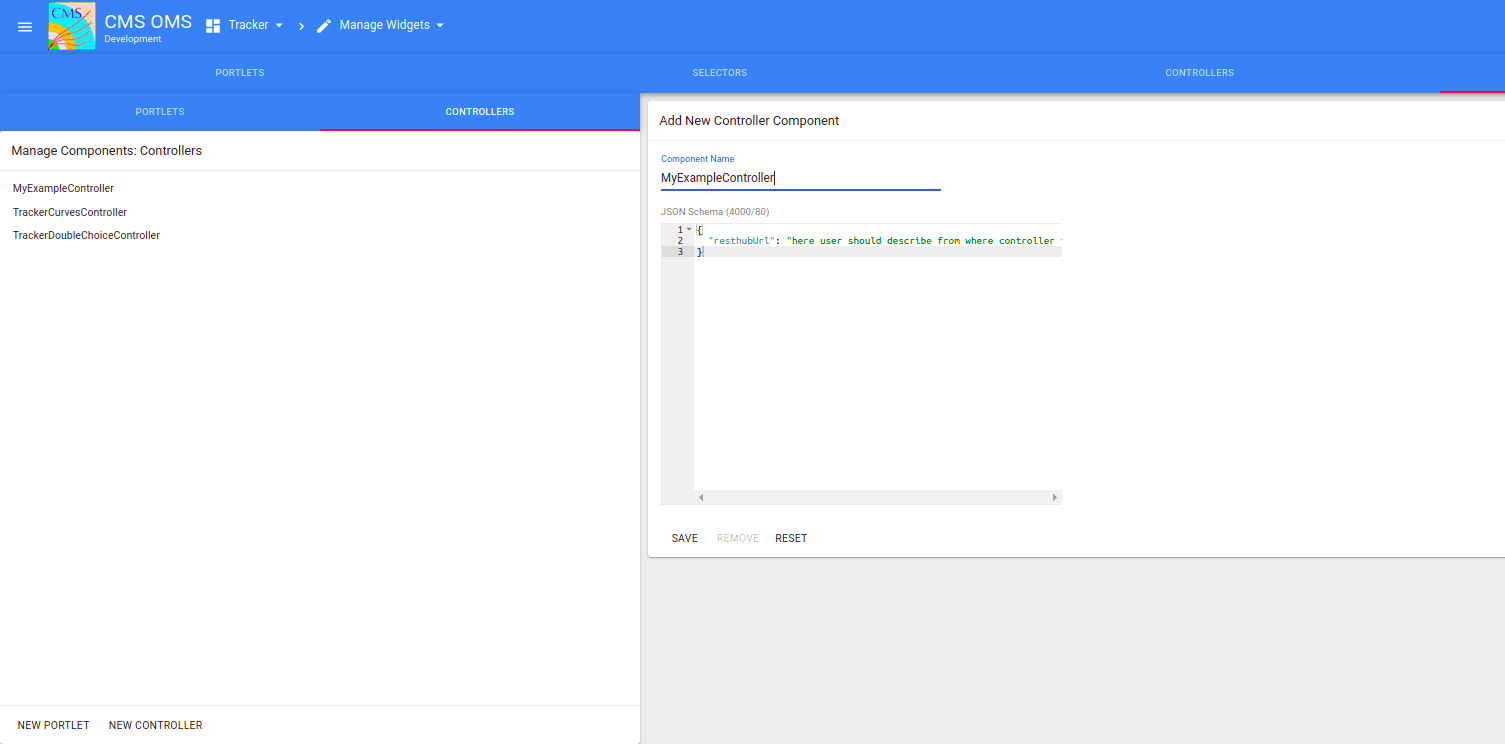
Controller
This is the final step while creating a controller before using it! In the example below show that user creates controller and fill all fields. Also, fill configuration as required. Because user wants to transfer selected data from controller to portlets he selects which selectors he add to this controller.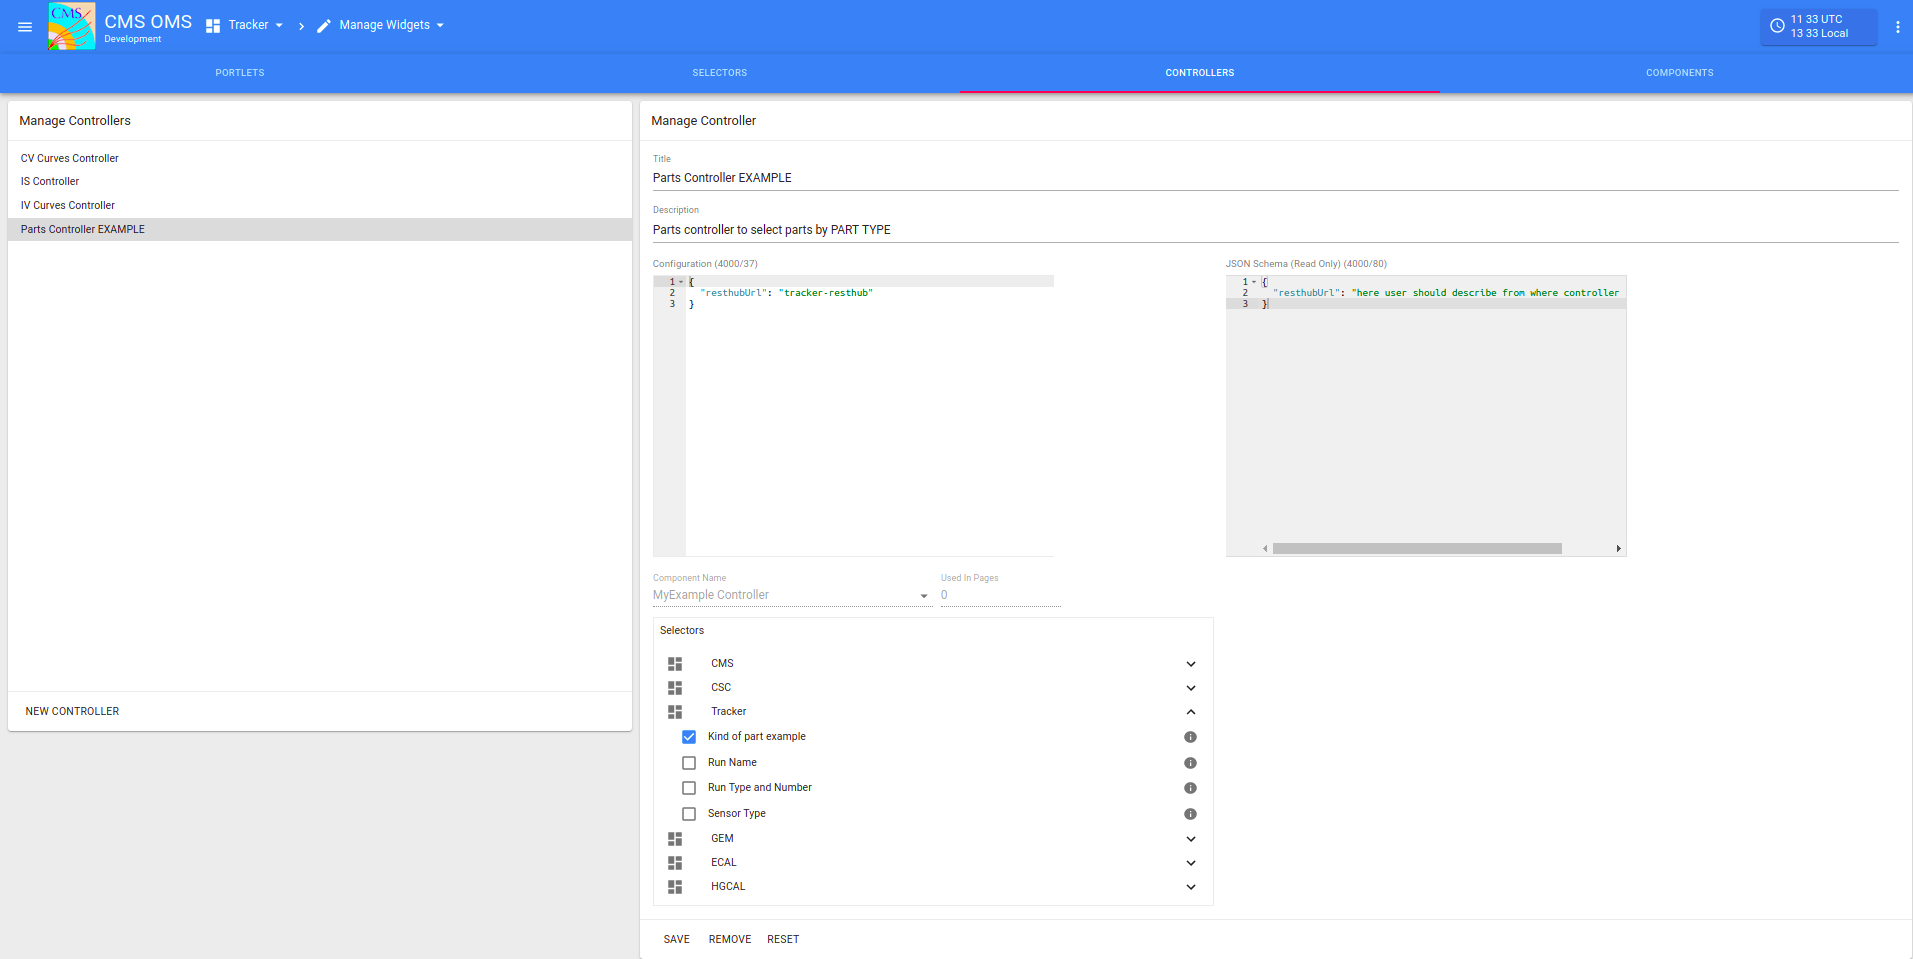
Edit Page/Folders
The gif below shown how privileged user can create new folders and pages by selecting the controller for the page. Change the order of pages and folders.
Add Portlet into page
A privileged user can easily add, remove, resize or even change position or portlets.Create table
A user simply can create table in two different ways. In both ways steps are similar almost till the end.- Create component for Table. We already have a component for resthub table. So the user simply has to go to 2nd step unless he created a specific component of the table by himself.
- Create a table. In different sections below are shown two different ways to create a table.
Table with selectors (to use controller filter)
In our example, we use IV Curves controller where we have 2 selectors: Run Name and Sensor Type.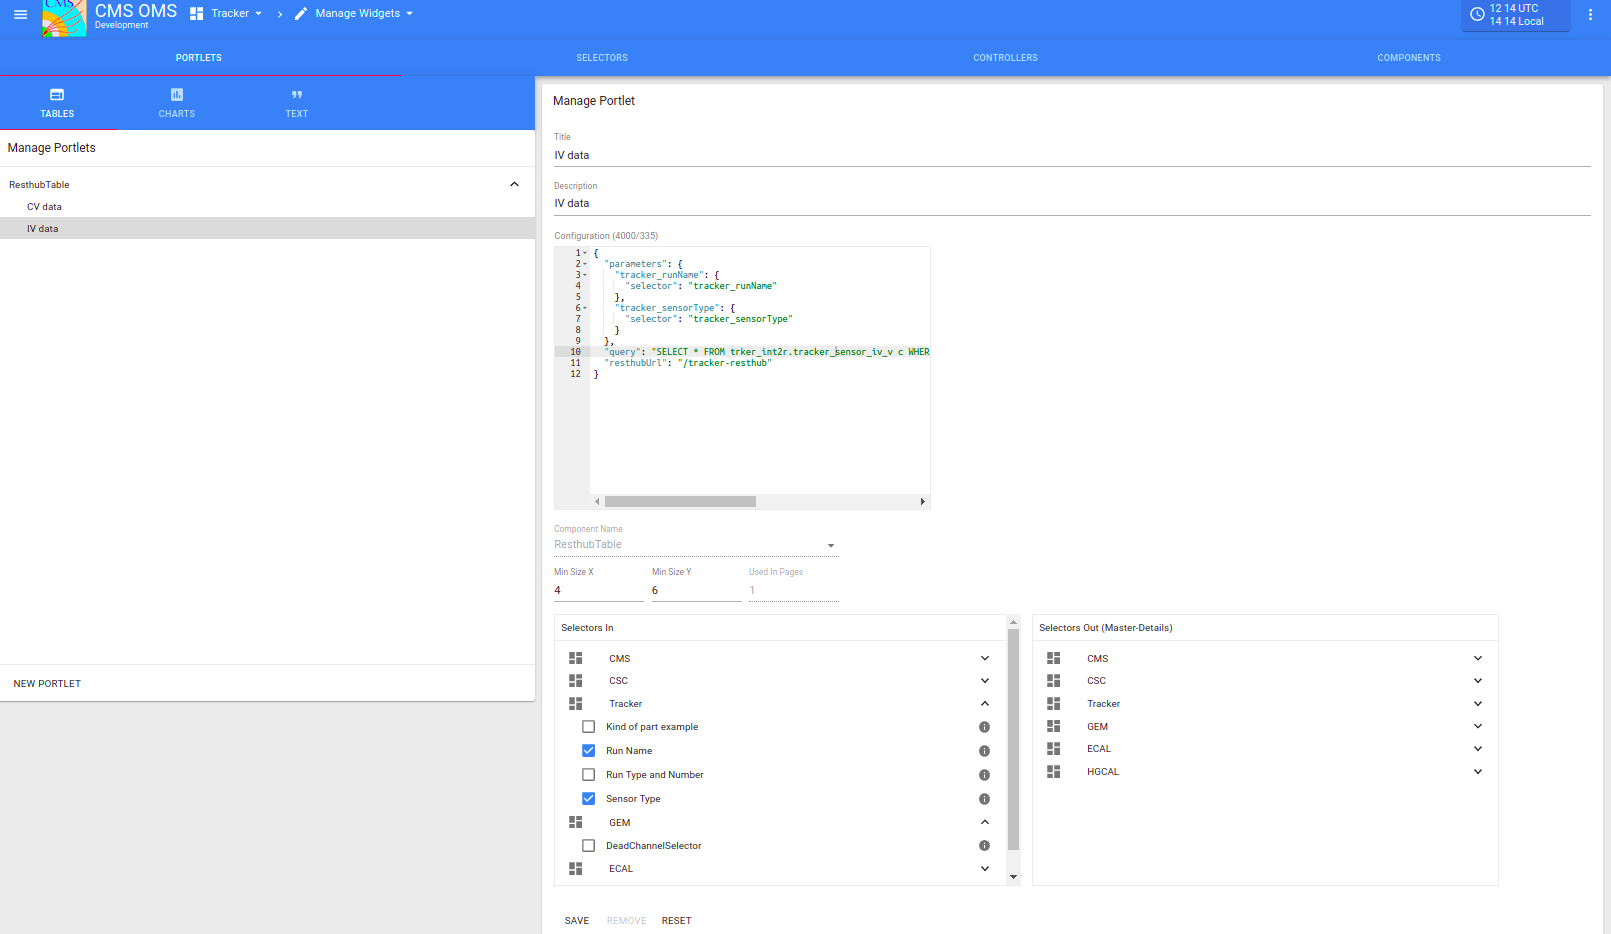 The picture above shows that we have a configuration for this table.
{
  "parameters": {
    "tracker_runName": {
      "selector": "tracker_runName"
    },
    "tracker_sensorType": {
      "selector": "tracker_sensorType"
    }
  },
  "query": "SELECT * FROM trker_int2r.tracker_sensor_iv_v c WHERE c.SENSOR = :tracker_sensorType AND c.RUN_NAME = :tracker_runName",
  "resthubUrl": "/tracker-resthub"
}
it is important to understand that the parameters - selectors, which we use in our query. A query could be simple as this or much more difficult with joins, ordering, sorting, different column names and much more. Basically as SQL.
In our example, we select all data from tracker_sensor_iv_v view where sensor and run_name will be elements selected in the controller.
Dummy table
This table similar to the table with selectors. Just a different thing is that this table doesn't expect to go get data from the controller. The picture below shows how it looks like.
Difference between tables
GIF below shows how we can add both tables to page and what is the difference. In example added both created tables. And we can see, that if we change data in controller only one table changes accordingly. It also showed how the user can filter data even in a dummy table. Also how to add or remove columns.
Create Dynamic Linear chart
At this moment (January of 2020) we have only one dynamic chart - linear chart. In this example below are shown how to create it. In order to have a chart with different data There are several steps: 1. Go to charts management menu as shown below. 2. Fill configuration. On the left side, an example is shown.
{
  "URLDescription": "We use url for resthub service to retrieve data. We should describe which view we use and which columns we want to retrieve",
  "logarithmic": true,
  "logarithmicDescription": "logarithmic could be true or false depends on user. If he wants to have this selection",
  "paramForTitle": "dynamic parameter which we use in url. To have title by selection. e.g tracker_sensorType",
  "resthubUrl": "resthub URL for tracker: /tracker-resthub",
  "series": {
    "0": {
      "name": "Serie name e.g. Temperature (C),",
      "yAxis": "if we have more than 1 y axis, we describe which axis we want to use e.g. 0"
    }
  },
  "title": "chart title e.g. 'CV Curves'",
  "url": "select t.VOLTS volts, t.CAP_PFRD cap, t.RH_PRCNT prcnt, t.TEMP_DEGC temp from trker_int2r.tracker_sensor_cv_v t where t.SENSOR = tracker_sensorType and t.RUN_NAME = tracker_runName ORDER BY t.VOLTS ASC",
  "xAxisName": "X Axis name. e.g. Volts",
  "xAxisObjectName": "this object is described in URL. e.g. volts",
  "yAxes": {
    "0": {
      "reversed": "false or true. if we want to have reversed axis - true ",
      "serie": "Series number to which serie we reflect e.g. 0",
      "text": "Series name, e.g. Temperature (C)",
      "yAxisObjectName": "Object name from url. e.g. temp"
    }
  }
}
For e.g. for cv data we have the configuration like this:
{
  "logarithmic": false,
  "paramForTitle": "tracker_sensor_type",
  "resthubUrl": "/tracker-resthub",
  "series": {
    "0": {
      "name": "Temperature (C),",
      "yAxis": 0
    },
    "1": {
      "name": "CAP,",
      "yAxis": 1
    },
    "2": {
      "name": "RH  (%)",
      "yAxis": 2
    }
  },
  "title": "CV Curves",
  "url": "select t.VOLTS volts, t.CAP_PFRD cap, t.RH_PRCNT prcnt, t.TEMP_DEGC temp from trker_int2r.tracker_sensor_cv_v t where t.SENSOR = tracker_sensorType and t.RUN_NAME = tracker_runName ORDER BY t.VOLTS ASC",
  "xAxisName": "Volts",
  "xAxisObjectName": "volts",
  "yAxes": {
    "0": {
      "reversed": false,
      "serie": "0",
      "text": "Temperature (C)",
      "yAxisObjectName": "temp"
    },
    "1": {
      "reversed": false,
      "serie": "1",
      "text": "CAP (cap)",
      "yAxisObjectName": "cap"
    },
    "2": {
      "reversed": false,
      "serie": "2",
      "text": "RH  (%)",
      "yAxisObjectName": "prcnt"
    }
  }
}
-- Aivaras Silale - 2019-12-12 

| I | Attachment | History | Action | Size | Date | Who | Comment |
|---|---|---|---|---|---|---|---|
| |
chart.gif | r1 | manage | 1728.2 K | 2020-01-07 - 13:20 | AivarasSilale | |
| |
controller.gif | r1 | manage | 1005.5 K | 2019-12-13 - 12:15 | AivarasSilale | |
| |
controller.png | r1 | manage | 74.4 K | 2019-12-13 - 12:35 | AivarasSilale | |
| |
controllerComponent.png | r1 | manage | 48.3 K | 2019-12-13 - 12:52 | AivarasSilale | |
| |
differenttables.gif | r1 | manage | 6932.0 K | 2019-12-13 - 13:38 | AivarasSilale | |
| |
dummytable.png | r1 | manage | 57.6 K | 2019-12-13 - 13:25 | AivarasSilale | |
| |
ivselector.png | r1 | manage | 78.2 K | 2019-12-13 - 13:25 | AivarasSilale | |
| |
mypage2.gif | r1 | manage | 650.6 K | 2019-12-12 - 17:24 | AivarasSilale | |
| |
page.gif | r1 | manage | 769.3 K | 2019-12-13 - 12:52 | AivarasSilale | |
| |
selector.png | r1 | manage | 46.1 K | 2019-12-13 - 12:35 | AivarasSilale | |
| |
structure.png | r1 | manage | 51.1 K | 2019-12-13 - 09:55 | AivarasSilale |
Topic revision: r6 - 2020-06-23 - AivarasSilale
Webs
- ABATBEA
- ACPP
- ADCgroup
- AEGIS
- AfricaMap
- AgileInfrastructure
- ALICE
- AliceEbyE
- AliceSPD
- AliceSSD
- AliceTOF
- AliFemto
- ALPHA
- Altair
- ArdaGrid
- ASACUSA
- AthenaFCalTBAna
- Atlas
- AtlasLBNL
- AXIALPET
- CAE
- CALICE
- CDS
- CENF
- CERNSearch
- CLIC
- Cloud
- CloudServices
- CMS
- Controls
- CTA
- CvmFS
- DB
- DefaultWeb
- DESgroup
- DPHEP
- DM-LHC
- DSSGroup
- EGEE
- EgeePtf
- ELFms
- EMI
- ETICS
- FIOgroup
- FlukaTeam
- Frontier
- Gaudi
- GeneratorServices
- GuidesInfo
- HardwareLabs
- HCC
- HEPIX
- ILCBDSColl
- ILCTPC
- IMWG
- Inspire
- IPv6
- IT
- ItCommTeam
- ITCoord
- ITdeptTechForum
- ITDRP
- ITGT
- ITSDC
- LAr
- LCG
- LCGAAWorkbook
- Leade
- LHCAccess
- LHCAtHome
- LHCb
- LHCgas
- LHCONE
- LHCOPN
- LinuxSupport
- Main
- Medipix
- Messaging
- MPGD
- NA49
- NA61
- NA62
- NTOF
- Openlab
- PDBService
- Persistency
- PESgroup
- Plugins
- PSAccess
- PSBUpgrade
- R2Eproject
- RCTF
- RD42
- RFCond12
- RFLowLevel
- ROXIE
- Sandbox
- SocialActivities
- SPI
- SRMDev
- SSM
- Student
- SuperComputing
- Support
- SwfCatalogue
- TMVA
- TOTEM
- TWiki
- UNOSAT
- Virtualization
- VOBox
- WITCH
- XTCA
Welcome Guest Login or Register
 |
|
or Ideas, requests, problems regarding TWiki? use Discourse or Send feedback