TWiki> Main Web>TWikiUsers>MichelePinamonti>UnitsHiggsTutorial (2015-12-15, MichelePinamonti)
 EditAttachPDF
HEP MC and Data Analysis Tutorial
Tutorial per il corso di Fisica Nucleare e Subnucleare, Dipartimento di Fisica, Università degli Studi di Trieste. Slides: HepTutorialUniTS_Pinamonti_2015.pdfReferences
MadGraph
- homepage: http://madgraph.hep.uiuc.edu/

- download page: https://launchpad.net/mg5amcnlo
Delphes
- homepage: https://cp3.irmp.ucl.ac.be/projects/delphes
- list of branches: https://cp3.irmp.ucl.ac.be/projects/delphes/wiki/WorkBook/RootTreeDescription
- to install it from MG5 shell:
install Delphes
ROOT
- homepage: http://root.cern.ch/drupal/
- reference guide: http://root.cern.ch/root/html/
- to set it up on your ts-dip-phys pc:
source setup.sh
Lecture 1
To start
Preliminary steps:- create a folder
HiggsTutorial, which will be our "working directory" - dowload the latest stable version of MadGraph5 from this site: https://launchpad.net/mg5amcnlo (should be
MG5_aMC_v2.3.3) - move the dowloaded file (
MG5_aMC_v2.3.3.tar.gz) to our working directory and extract it (a new sub-directoryMG5_aMC_v2_3_3should have been created, which we will call "MG5 direcotry") - copy the script
setup.sh(attached here: setup.sh) inside the working directory - from a terminal, from inside the working directory, execute the command
source setup.sh: this will setup ROOT, gcc and python, and has to be done each time we open a new termnal (!) - test MadGraph: from inside the MG5 directory, from the terminal execute:
./bin/mg5_aMC; if it works you should be inside the MG5 shell - try to generate a physics process: from inside the MG5 shell, give the command
generate p p > t t~(this should prepare the generation of pp -> ttbar events) - exit MG5 shell, with CTRL+D
- eventually modify the MG5 settings for the used browser and text editor: modify the text file
input/mg_configuration.txtaccordingly (suggested gedit or nano as text editor, firefox as browser) - enter the MG5 shell: from the MG5 directory, from a terminal (after the setup!) type
./bin/mg5_aMC - type
install pythia-pgsto install Pythia6 (parton shower and hadronisation software) - type
install Delphesto install the latest version of Delphes (detector simulation and object reconstruction fast simulation software)
Generate Processes with MadGraph
Let's start with the MG5 tutorial:- from the MG5 shell, type
tutorial - follow the instructions on the screen
- if you already have a ttbar directory, you can directly move to point 5
- from the MG5 shell, type
generate p p > t t~ - then create the output directory, still from the MG5 shell, typing
output ttbar - exit MG5 (CTRL+D)
- enter the
ttbardirectory - enter the
MadEventshell:./bin/generate_events - leave/set everything to FALSE (by typing 1, 2, 3, 4 or 5 and pressing ENTER each time)
- press enter when ok
- now we are asked to modify the cards: we want to change both the CME and the top mass, so we have to modify both
run_card.datandparam_card.dat - to modify
run_card.dattype 2, then ENTER - find the lines with the energies of the two beams and set them to 3500 GeV each
- when finished, save the file and exit
- now you can modify
param_card.dattyping 1, then ENTER - find the line like
6 1.730000e+02 # MT, and set 1.725000e+2 instead of 1.730000e+02 - when finished, save the file and exit
- then press ENTER and the computation will start
- wait few minutes you should get the result: you can read it from the screen or from the file
ttbar/crossx.html
Process MadGraph outputs: Pythia, MadSpin and Delphes
We already installed Pythia. Now we can turn it on when generating events, in order to also simulate the parton shower and the hadronisation:- if you already have a ttbar directory, you can directly move to point 5
- from the MG5 shell, generate the usual test process
generate p p > t t~ - create an output directory: output
output ttbar - exit MG5 (CTRL+D)
- enter the ttbar directory:
cd ttbar - enter
MadEventshell:./bin/generate_events - switch Pythia to ON
- type 0, ENTER, and then again 0, ENTER
- the events will be generated with Pythia switched ON
- we can give a look at the text file called
tag_1_pythia.loginside the directoryttbar/Events/run_01/: this log contains, among other info, the full record of the fort 10 generated events (you can see the initial protons, the inital partons, the intermediate tops and their decay products, as well as all the products of the subsequent parton shower and hadronisation - quite a long list...)
- switch/leave Pythia and Delphes ON
Read Delphes outputs
First exercise:- dowload the file
MyReader.Cfrom here: MyReader.C, and put it inside the directoryDelphes/examples(note: it's inside MG5 directory) - open the file with a text editor
- uncomment the proper lines in order to create, fill and show a histogram, then save the file
- run the macro on the latest MG5 run output: from a terminal (again after the usual setup!), go to the directory
Delphesand typeroot -l 'examples/MyReader.C("../ttbar/Events/run_XX/tag_1_delphes_events.root")'
- plot the number of leptons (electron and muons) instead
- plot the number of jets and the pT of the highest pT one in each event
- print the fraction of events with at least two leptons (electrons or muons) and at least two jets
- plot the number of b-tagged jets (hint: look at the Dephes list of branches, link on top of this page)
- plot the number of jets with pT>40 GeV
Decay particles inside MadGraph
Now we want to also have tops (and Ws) decaying withing MG5 (so keeping the spin information, which is lost in Pythia!).- from the MG5 shell, generate the usual test process, but with some additional text:
generate p p > t t~, (t > w+ b, w+ > l+ vl), (t~ > w- b~, w- > l- vl~) - create an output directory: output
output ttbar_dilep - proceed as before
- look inside the directory
ttbar_dilep/SubPriocesses/P1_gg_ttx_t_wpb_wp_lvl_tx_wmbx_wm_lvl, at the ps filesmatrix1andmatrix2; compare with what you have generated in the previous example (directoryttbar)
- from the MG5 shell, first give the command
define j = j b b~(this will include b-jet production in association with Z) - generate the process
generate p p > z j j, z > l+ l- - create an output directory: output
output zjj_dilep - exit MG5 (CTRL+D)
- enter the ttbar directory:
cd zjj_dilep
Lecture 2 and 3
Useful Formulae
Cross section (x), integrated luminosity (Lumi) and number of events (N):-

- if xsec = 500pb, to simulate 100
 of data, we expect
  events
- if we have N = 100 000 simulated events, for a process with
 , and we want to compare with 25
  of data, we need to scale them by
Preliminary Exercise:
Goal:- simulate Z->lep lep events
- analyse produced events:
- select events
- draw histogram for lep-lep invariant mass
- fit it with a Gaussian to measure Z boson mass
- repeat the exercise for different mass values
- generate the events:
- as usual,
./bin/mg5_aMC - in MG5 shell:
generate p p > z, z > l+ l-(orgenerate p p > z > l+ l-, it's the same) -
output zll - exit MG5, enter zll directory, enter MadEvent:
./bin/generate_events - set Pythia ON, Delphes ON, the rest OFF
- check in param card the mass of the Z boson
- keep 10'000 as number of events in run card
- as usual,
- Try the root macro MyReader.C on the ouput (see above)
- Try the root macro MyZmass.C
- Fit the output histogram to get the measured Z mass: see example macro MyFitZmassC
- try both with a Gaussian and a BW
- Modify
MyZmass.Cin order to use also di-muon events - Generate more samples with different values of Z mass, eg 85, 88, 90, 91, 92, 94, 97 GeV (you have to modify the param card in MG5)
- Fit each of them and build a table of generated mass vs fitted mass
Main Exercise:
Goal:- select events coming from h->ZZ->4 lep and to produce a histogram with the reconstructed Higgs mass in these events
- compare "data" with MC simulation for Higgs signal and ZZ background
- everything should be done at CME = 8 TeV, considering the data integrated luminosity of 25
- find the Delphes output here: data_events.root
- as usual,
./bin/mg5_aMC - IMPORTANT: before the
generatecommand, typeimport model heft -
generate p p > h > l+ l- l+ l- -
output h4lep - exit MG5, enter h4lep directory, enter MadEvent:
./bin/generate_events - set Pythia ON, Delphes ON, the rest OFF
- when prompted, modify the run card:
- set the CME to 8 TeV (4000 GeV each beam)
- check that
False = cut_decays(should be by default in latest MG5)
- (eventually change the Higgs mass in the param card)
- IMPORTANT: multiply the signal x-sec given by MG5 by 10 (at LO both the x-sec and the BR are underestimated)
- as usual,
./bin/mg5_aMC -
generate p p > l+ l- l+ l- /h(the/hexcludes the Higgs as intermediate state) -
output zz4lep - exit MG5, enter h4lep directory, enter MadEvent:
./bin/generate_events - set Pythia ON, Delphes ON, the rest OFF
- when prompted, modify the run card:
- set the CME to 8 TeV (4000 GeV each beam)
- check that
False = cut_decays(should be by default in latest MG5)
- look at the code
MyHiggs4l.C: MyHiggs4l.C- use it as a template for your macro to create a histogram out of each delphes output files (signal, background, data)
- the two inputs to the macro are the name of the root file with the delphes output and the output file where to store the histogram
- example:
-
root -l -b -q 'examples/MyHiggs4l.C("../h4lep/Events/run_01/tag_1_delphes_events.root","signal.root")' -
root -l -b -q 'examples/MyHiggs4l.C("../zz4lep/Events/run_01/tag_1_delphes_events.root","background.root")' -
root -l -b -q 'examples/MyHiggs4l.C("data_events.root","data.root")'
-
- then look at the code
MyHistMerger.C: MyHistMerger.C- use it as a template for your code to read the three inputs and merge them in a final plot
- note the signal x-sec multiplied by 10
Additonal exercises:
- measure the signal x-section:
- define an event selection (based on the Higgs mass?)
- express the x-section as
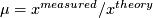 , where
  is the MG5 one x10 (see above)
- measure the Higgs mass:
- try different mass values for the signal MC and compare them with data (chi2 test?)
- try an anlystical fit with a gaussian after subtracting background from data
- hint: you might consider to use a finer binning in the histogram
OLD STUFF - obsolete
Lecture 2
Useful Formulae
Cross section (x), integrated luminosity (Lumi) and number of events (N):-
- if xsec = 500pb, to simulate 100 of data, we expect events
- if we have N = 100 000 simulated events, for a process with , and we want to compare with 25 of data, we need to scale them by
-

- N is observed in data after event selection
- B is obtained from background simulation scaled to Lumi and bkg x-sec (see above)
- eff is the signal selection efficiency:
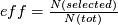 , from simulated data events
Ttbar cross section measurement
The problem:- we have a "data" sample corresponding to 3 of data from the LHC at CME = 7 TeV
- we want to measure the cross-section for the total top-antitop production using this data
- we want to select events with 1 electron or muon, missing energy and jets (eventualy b-jets), the so called "single lepton channel"
- the "data": find them attached here: tag_1_delphes_events.root
- signal simulation
- background simulation (W+jets)
- the formula:
- we want to select electrons, muons and jets only if they have pT>25 GeV and |eta|<2.5
- we want to ask also for MET>25 GeV
- we can then play around with the request of how may jets, how many b-tagged jets, eventually higher pT threshold for jets...
- you can use / give a look at the macro here: MyEventCounter.C
- we want to minimize the relative statistical uncertainty:
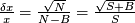
-
generate p p > t t~ - IMPORTANT: we want all the decays of the tops, so set the decays of the W's from the tops to "all" in MadSpin card (or switch OFF MadSpin)
- don't forget to set the CME to 7 TeV
- number of events: you need to generate ~10 times more than what you expect in data
- to obtain
effin the formula, divide the number of events after and before the event selection (done automatically inMyEventCounter.C)
-
define w = w+ w- -
define j = j b b~(this includes the b's to our definition ofj) -
generate p p > w j j - to be more efficient, here you can set the W decays to e / mu / tau only (note: you need to include the tau!)
- don't forget to set the CME to 7 TeV
- number of events: you need to generate ~10 times more than what you expect in data
- to obtain
Bin the formula, you need to scale the number of selected events as explained above
-
define w = w+ w- -
define j = j b b~(this includes the b's to our definition ofj) -
generate p p > t t~ -
add process p p > w j j -
output data_ljets - run a first test with Pythia ON and everything else OFF, 1000 events, to get the x-section
- get the number of events to generate for the real run as Lumi * xsec
- launch a second run with Delphes ON (MadSpin still OFF) with Nevents = Lumi * xsec
-- MichelePinamonti - 2014-12-15 -- MichelePinamonti - 2015-12-07


| I | Attachment | History | Action | Size | Date | Who | Comment |
|---|---|---|---|---|---|---|---|
| |
HepTutorialUniTS_Pinamonti_2015.pdf | r2 r1 | manage | 2865.5 K | 2015-12-15 - 09:30 | MichelePinamonti | |
| |
MyCreateData.C | r1 | manage | 0.7 K | 2014-12-07 - 23:03 | MichelePinamonti | |
| |
MyEventCounter.C | r1 | manage | 2.7 K | 2014-11-29 - 15:09 | MichelePinamonti | |
| |
MyFitZmass.C | r1 | manage | 2.5 K | 2015-12-14 - 10:04 | MichelePinamonti | |
| |
MyHiggs4l.C | r3 r2 r1 | manage | 2.3 K | 2014-12-09 - 09:18 | MichelePinamonti | |
| |
MyHistMerger.C | r1 | manage | 1.1 K | 2014-12-07 - 23:03 | MichelePinamonti | |
| |
MyReader.C | r1 | manage | 1.6 K | 2014-11-29 - 15:09 | MichelePinamonti | |
| |
MyZmass.C | r1 | manage | 1.6 K | 2015-12-14 - 10:04 | MichelePinamonti | |
| |
data_events.root | r2 r1 | manage | 7908.9 K | 2015-12-14 - 23:27 | MichelePinamonti | |
| |
delphes_card_ATLAS.dat | r1 | manage | 18.2 K | 2014-12-05 - 15:04 | MichelePinamonti | |
| |
setup.sh | r1 | manage | 0.2 K | 2014-12-01 - 09:13 | MichelePinamonti | |
| |
tag_1_delphes_events.root | r2 r1 | manage | 85266.4 K | 2014-12-09 - 11:22 | MichelePinamonti |
Topic revision: r23 - 2015-12-15 - MichelePinamonti
Webs
- ABATBEA
- ACPP
- ADCgroup
- AEGIS
- AfricaMap
- AgileInfrastructure
- ALICE
- AliceEbyE
- AliceSPD
- AliceSSD
- AliceTOF
- AliFemto
- ALPHA
- Altair
- ArdaGrid
- ASACUSA
- AthenaFCalTBAna
- Atlas
- AtlasLBNL
- AXIALPET
- CAE
- CALICE
- CDS
- CENF
- CERNSearch
- CLIC
- Cloud
- CloudServices
- CMS
- Controls
- CTA
- CvmFS
- DB
- DefaultWeb
- DESgroup
- DPHEP
- DM-LHC
- DSSGroup
- EGEE
- EgeePtf
- ELFms
- EMI
- ETICS
- FIOgroup
- FlukaTeam
- Frontier
- Gaudi
- GeneratorServices
- GuidesInfo
- HardwareLabs
- HCC
- HEPIX
- ILCBDSColl
- ILCTPC
- IMWG
- Inspire
- IPv6
- IT
- ItCommTeam
- ITCoord
- ITdeptTechForum
- ITDRP
- ITGT
- ITSDC
- LAr
- LCG
- LCGAAWorkbook
- Leade
- LHCAccess
- LHCAtHome
- LHCb
- LHCgas
- LHCONE
- LHCOPN
- LinuxSupport
- Main
- Medipix
- Messaging
- MPGD
- NA49
- NA61
- NA62
- NTOF
- Openlab
- PDBService
- Persistency
- PESgroup
- Plugins
- PSAccess
- PSBUpgrade
- R2Eproject
- RCTF
- RD42
- RFCond12
- RFLowLevel
- ROXIE
- Sandbox
- SocialActivities
- SPI
- SRMDev
- SSM
- Student
- SuperComputing
- Support
- SwfCatalogue
- TMVA
- TOTEM
- TWiki
- UNOSAT
- Virtualization
- VOBox
- WITCH
- XTCA
Welcome Guest Login or Register
 |
|
or Ideas, requests, problems regarding TWiki? use Discourse or Send feedback